Results at a glance
- Period
- FY2026Q3
- Revenue
- $20.2B (20,186 MUSD)
- Net income
- $756M (756 MUSD)
- Net margin
- 3.7%
From the Delta Air Lines Open LedgerView the live ledgerIssuer filing (FY2026Q3)
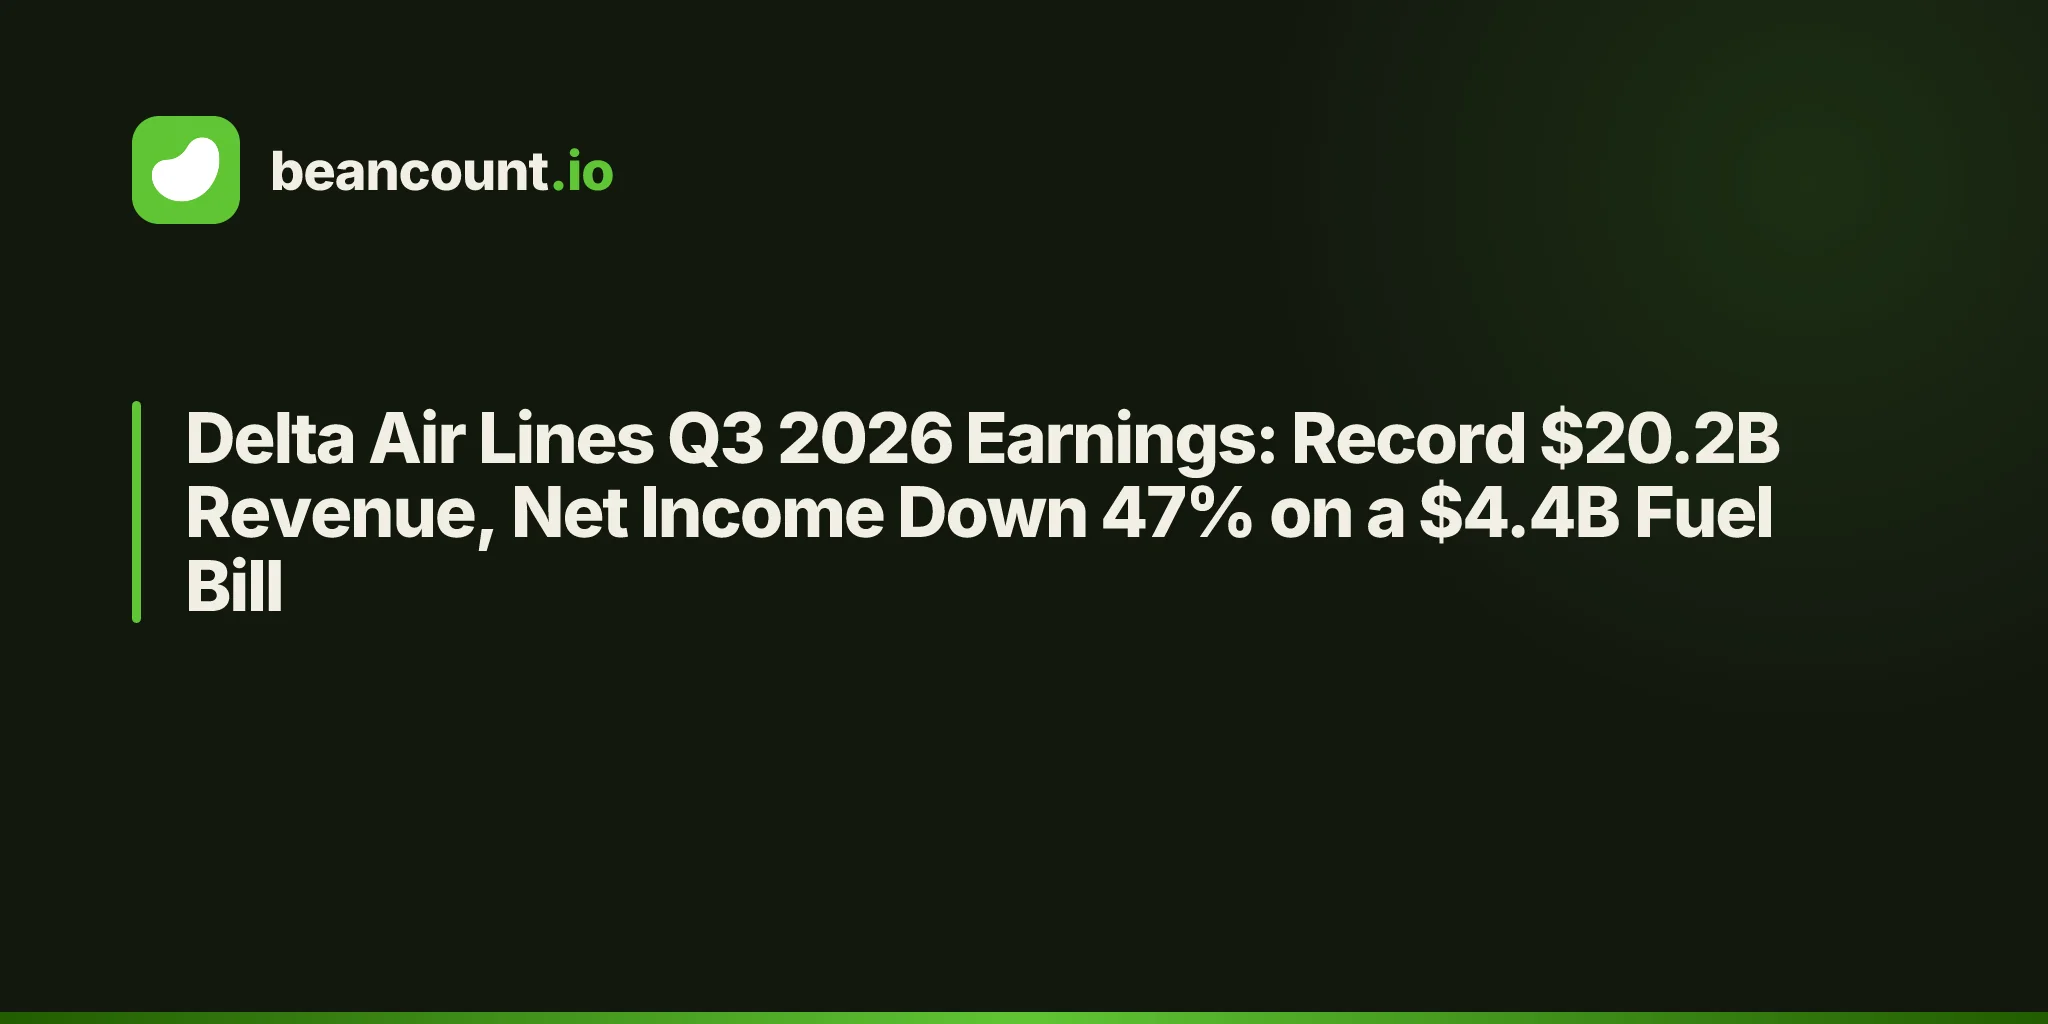
Delta Air Lines reported September-quarter revenue of $20.2 billion on October 9, 2026, up 21% and the highest quarterly total the company has filed. Net income fell 47% to $756 million. Two lines explain the gap. Aircraft fuel cost $4.35 billion, up 69% and larger than the record $4.1 billion of the June quarter. And the equity investments that added $311 million a year ago subtracted $218 million this time. Management cut its full-year earnings outlook from $6.50–$7.50 a share to $5.10–$5.60.
The Headline Numbers
Delta's fiscal year is the calendar year, so the third quarter of 2026 is the three months ended September 30, 2026. Every figure below comes from the Form 10-Q and the earnings release, both filed on October 9.
| Metric | Q3 2026 | Q3 2025 | YoY Change |
|---|---|---|---|
| Revenue | $20,186M | $16,673M | +21.1% |
| Operating income | $1,454M | $1,684M | −13.7% |
| Pre-tax income | $1,074M | $1,777M | −39.6% |
| Net income | $756M | $1,417M | −46.6% |
| Fuel expense | $4,351M | $2,570M | +69.3% |
| Diluted EPS | $1.15 | $2.17 | −47.0% |
| Operating margin | 7.2% | 10.1% | −2.9 pts |
| Adjusted diluted EPS (non-GAAP) | $1.72 | $1.70 | +1.2% |
The 47% decline in net income has three parts, and the income statement separates them. Operating income fell $230 million. Non-operating items swung by $473 million, from $93 million of income to $380 million of expense. Income tax was $42 million lower. Those three add up to the $661 million drop.
So about a third of the decline is the airline's operations and most of the rest is the mark-to-market value of its equity investments. That is why the company's adjusted earnings per share, which removes the investment losses and certain fuel-hedge results, was $1.72 against $1.70 a year ago. The adjusted figure is a fair reading of the operating business. It is also a non-GAAP number, and the ledger below records the filed one.
Revenue Deep Dive
The Q2 post asked whether premium and loyalty revenue could outrun a record fuel bill. The revenue half of that question got a clear answer in the September quarter.
| Revenue line | Q3 2026 | Q3 2025 | YoY |
|---|---|---|---|
| Ticket: premium products | $6,818M | $5,796M | +17.6% |
| Ticket: main cabin | $6,802M | $6,063M | +12.2% |
| Loyalty travel awards | $1,302M | $1,108M | +17.5% |
| Travel-related services | $612M | $539M | +13.5% |
| Passenger | $15,534M | $13,506M | +15.0% |
| Cargo | $301M | $233M | +29.2% |
| Refinery sales to third parties | $2,601M | $1,476M | +76.2% |
| Loyalty and related | $1,346M | $1,129M | +19.2% |
| MRO | $296M | $231M | +28.1% |
| Miscellaneous | $108M | $98M | +10.2% |
| Other | $4,351M | $2,934M | +48.3% |
Passenger revenue grew 15.0% while capacity was flat: available seat miles were 79,288 million against 79,054 million a year earlier. Growth with no added seats is price. Passenger mile yield rose 14% to 22.80 cents, and the load factor held at 86%. The release says revenue grew "on flat capacity, driven by broad demand strength and healthy yield growth as we cover higher costs and manage the business for margins."
Premium ticket revenue was larger than main cabin revenue in the quarter, $6,818 million against $6,802 million. A year earlier premium was $267 million smaller. Main cabin still grew 12.2%, and the release says main cabin unit revenue rose 17% "on seats down low-single digits." The airline is selling fewer economy seats at higher fares.
On demand, the release is direct: "Demand remains strong, supported by consumers' growing preference for experiences and travel." The 10-Q uses the phrase "broad based demand strength across premium, main, and loyalty." Neither document says demand exceeds supply or that capacity is sold out. Supply is tight here because Delta chose to keep it flat, and the release says December-quarter seats will grow "less than 2 percent, including a reduction in Main Cabin seats."
The loyalty lines kept their pace. Loyalty and related revenue rose 19.2%, and the 10-Q puts remuneration from American Express at $2.3 billion for the quarter, which the release says is 15% growth and on course to exceed $9 billion for the year. The 10-Q attributes most of the increase to "higher customer spend on American Express cards and new card acquisitions" after the co-brand card portfolio was refreshed in the June quarter.
One line in the table is not what it looks like. Refinery sales to third parties were $2,601 million, and refinery expense on the cost side was exactly $2,601 million. Delta's Monroe refinery sells the gasoline and diesel it does not need, and the filing books those sales and their cost at the same amount. They add $1.1 billion to revenue growth and nothing to profit. Without them revenue was $17,585 million, up 16%, which is the figure the release calls adjusted total revenue.
The Margin Story
| Period | Revenue | Operating margin | Net margin | Fuel as % of revenue |
|---|---|---|---|---|
| FY2021 | $29,899M | 6.3% | 0.9% | 18.8% |
| FY2022 | $50,582M | 7.2% | 2.6% | 22.7% |
| FY2023 | $58,048M | 9.5% | 7.9% | 19.1% |
| FY2024 | $61,643M | 9.7% | 5.6% | 17.1% |
| FY2025 | $63,364M | 9.2% | 7.9% | 15.5% |
| Q2 2026 | $19,757M | 9.4% | 8.1% | 20.8% |
| Q3 2026 | $20,186M | 7.2% | 3.7% | 21.6% |
Operating margin fell 2.2 points from the June quarter and 2.9 points from a year ago. The fuel ratio explains it. Fuel took 21.6% of revenue, against 15.4% in the September quarter of 2025 and 15.5% for all of 2025. The 10-Q says the increase came "primarily due to a 63% increase in our average jet fuel purchase price." Gallons consumed rose 1%.
| Cost line | Q3 2026 | Q3 2025 | YoY |
|---|---|---|---|
| Salaries and related costs | $4,822M | $4,443M | +8.5% |
| Aircraft fuel and related taxes | $4,351M | $2,570M | +69.3% |
| Refinery expense | $2,601M | $1,476M | +76.2% |
| Contracted services | $1,277M | $1,166M | +9.5% |
| Landing fees and other rents | $1,021M | $921M | +10.9% |
| Regional carrier expense | $680M | $649M | +4.8% |
| Maintenance materials and outside repairs | $662M | $667M | −0.7% |
| Profit sharing | $389M | $392M | −0.8% |
| Total operating expense | $18,732M | $14,989M | +25.0% |
Total operating expense rose $3,743 million, more than the $3,513 million rise in revenue. Fuel and refinery expense account for $2,906 million of it. Everything else, $11,780 million in total, rose 7.6% on flat capacity. Salaries grew 8.5%, which the 10-Q ties to 4% base pay increases, a pay-scale step-up and "increases in premium pay from operational disruptions." The company's own measure of non-fuel unit cost rose 7.3%.
Pricing did real work against this. Yield rose 14%, and that pricing covered the non-fuel cost growth with room to spare. It did not cover a 69% fuel bill. The net margin of 3.7% is the lowest in the ledger since FY2022, and $218 million of investment losses and a 29.6% effective tax rate, up from 20.3% a year earlier, took it there from a 7.2% operating margin.
The One Big Question: Did the Premium and Loyalty Engine Outrun Fuel?
It did not, and the company's own July guidance is the measure. With the June-quarter results, Delta guided the September quarter to adjusted earnings of $2.00 to $2.50 a share on an operating margin of 11% to 13%, assuming an all-in fuel price of about $3.15 a gallon. Revenue was guided up mid-teens.
| September quarter 2026 | July guidance | Reported (adjusted) |
|---|---|---|
| Total revenue growth | Up mid-teens | +16% |
| Operating margin | 11% to 13% | 9.4% |
| Earnings per share | $2.00 to $2.50 | $1.72 |
| Fuel price per gallon | About $3.15 | $3.61 |
Revenue landed at the top of the guide. Margin and earnings missed the bottom of it. The fuel line is the whole difference: 46 cents a gallon above the assumption, across 1,146 million gallons, is about $527 million by our arithmetic. The release gives the same figure in words, saying the quarter absorbed "more than $500 million of higher fuel costs compared to our guidance in early July."
The refinery did not help. The Q2 post noted that the refinery benefit was only 11 cents a gallon. In the September quarter it was 13 cents, and the 10-Q reports that the refinery segment ran an operating loss of $33 million, against $53 million of income a year earlier, after an outage that halted production in mid-June. The same filing records $416 million of losses on fuel hedge contracts inside the fuel line for the quarter.
The outlook says management expects more of the same. December-quarter guidance assumes fuel of about $4.25 a gallon, an operating margin of 7% to 9%, and earnings of $1.15 to $1.65 a share on revenue growth of about 20%. The full-year changes are large:
| Full-year 2026 outlook | In July | In October |
|---|---|---|
| Earnings per share | $6.50 to $7.50 | $5.10 to $5.60 |
| Free cash flow | $3 billion to $4 billion | About $2.5 billion |
| Gross leverage | About 2x | About 2.2x |
The release frames this as "structural durability in high fuel cost environment," and says the year will absorb "a $6 billion increase in fuel costs." Both statements can be true alongside the table. The business stayed profitable through a 69% rise in its fuel bill. It also expects to earn about a quarter less this year than it did three months ago.
Tracking a $63.4B company in plain text
A double-entry ledger shows where a profit decline sits, because every line has to be posted to an account. The transaction below is the quarter as pushed to open_ledger/delta-air-lines, following how we model every company. Income is negative, expenses are positive, and the final posting to Equity:Adjustments is net income, so the whole transaction sums to zero.
; FY2026Q3 Income Statement — three months ended 2026-09-30
; Check: -20,186 + 4,822 + 4,351 + 2,601 + 1,277 + 1,021 + 662 + 680 + 703 + 673 + 494 + 267 + 389 + 159 + 633 + 0 + 146 + 218 - 2 + 18 + 318 + 756 = 0 ✓

2026-09-30 * "Delta Air Lines, Inc." "FY2026Q3 Income Statement"
  Income:Revenue                         -20,186 MUSD  ; passenger 15,534 + cargo 301 + other 4,351
  Expenses:CostOfRevenue                     4,822 MUSD  ; salaries and related costs
  Expenses:CostOfRevenue                     4,351 MUSD  ; aircraft fuel and related taxes
  Expenses:CostOfRevenue                     2,601 MUSD  ; refinery expense
  Expenses:CostOfRevenue                     1,277 MUSD  ; contracted services
  Expenses:CostOfRevenue                     1,021 MUSD  ; landing fees and other rents
  Expenses:CostOfRevenue                       662 MUSD  ; aircraft maintenance materials and outside repairs
  Expenses:CostOfRevenue                       680 MUSD  ; regional carrier expense
  Expenses:SellingGeneralAdministrative        703 MUSD  ; passenger commissions and other selling expenses
  Expenses:CostOfRevenue                       673 MUSD  ; depreciation and amortization
  Expenses:CostOfRevenue                       494 MUSD  ; passenger service
  Expenses:CostOfRevenue                       267 MUSD  ; MRO expense
  Expenses:CostOfRevenue                       389 MUSD  ; profit sharing
  Expenses:CostOfRevenue                       159 MUSD  ; aircraft rent
  Expenses:CostOfRevenue                       633 MUSD  ; other operating expense
  Expenses:ResearchAndDevelopment                0 MUSD  ; not separately disclosed
  Expenses:OtherNet                            146 MUSD  ; interest expense, net
  Expenses:OtherNet                            218 MUSD  ; loss on investments, net
  Expenses:OtherNet                             -2 MUSD  ; gain on extinguishment of debt
  Expenses:OtherNet                             18 MUSD  ; miscellaneous, net
  Expenses:IncomeTax                           318 MUSD
  Equity:Adjustments                           756 MUSD  ; net income offset (RE set by balance assertion)
Compare the investment line with the June quarter's file. There it was Income:OtherNet -349, a gain. Here it is Expenses:OtherNet 218, a loss. That one account moved $567 million between two consecutive quarters, more than the $410 million change in operating income over the same span. Delta's reported profit depends partly on the market value of the companies it holds stakes in, and the ledger keeps that on its own line where it can be read apart from flying.
The balance-sheet number that tells the story this quarter is debt. The two debt accounts hold $12,851 million at September 30, down $1,101 million from $13,952 million at June 30. Cash went the other way, from $4,665 million to $3,787 million. Delta used a seasonally strong quarter to repay $1.2 billion of debt and finance leases while fuel was at its most expensive. Property and equipment rose to $42,206 million from $41,544 million as 13 aircraft arrived, and the air traffic liability, which is tickets sold for future travel, fell from $10.0 billion to $9.6 billion as summer bookings were flown.
The Multi-Year Arc
| Period | Revenue | Net income | Net margin | PP&E | Total assets |
|---|---|---|---|---|---|
| FY2021 | $29,899M | $280M | 0.9% | $28,749M | $72,459M |
| FY2022 | $50,582M | $1,318M | 2.6% | $33,109M | $72,288M |
| FY2023 | $58,048M | $4,609M | 7.9% | $35,486M | $73,644M |
| FY2024 | $61,643M | $3,457M | 5.6% | $37,595M | $75,372M |
| FY2025 | $63,364M | $5,005M | 7.9% | $39,743M | $81,317M |
| Q2 2026 | $19,757M | $1,604M | 8.1% | $41,544M | $86,321M |
| Q3 2026 | $20,186M | $756M | 3.7% | $42,206M | $86,048M |
The ledger holds five annual periods and the two most recent quarters; it does not hold the March quarter. The 10-Q's nine-month column fills that gap: revenue of $55,797 million, up 17.8%, and net income of $2,070 million, down 45.3%, with fuel of $11,202 million, up 50.6%.
Read across the years, the pattern is that Delta's net margin tracks its fuel ratio more closely than its revenue. Fuel was 22.7% of revenue in FY2022 and the net margin was 2.6%. Fuel fell to 15.5% in FY2025 and the net margin reached 7.9%. The September quarter of 2026 sits back near the FY2022 fuel ratio, on a revenue base that is far larger and richer in premium and loyalty income. Operating margin is the fairer comparison between those two periods because it leaves out investment results, and it matches exactly: 7.2% in FY2022 and 7.2% now.
Equity tells the longer story. Total stockholders' equity was $3,887 million at the end of FY2021 and is $22,513 million now, with retained earnings of $14,883 million. Property and equipment grew by $13.5 billion over the same period while debt and finance leases fell from $26,920 million to $12,851 million. That is the balance sheet the dividend is paid from: $0.2150 a share in the quarter, $141 million in cash. The 10-Q notes that no shares have been repurchased under the $1.0 billion program authorized in 2025.
The Verdict: Bull vs. Bear
Bull Case
- Pricing is carrying the revenue line. Passenger revenue rose 15.0% on flat capacity, with yield up 14% and the load factor steady at 86%.
- Premium has passed main cabin. Premium ticket revenue of $6,818 million grew 17.6% and was larger than main cabin revenue in the quarter.
- Loyalty income keeps compounding. American Express remuneration was $2.3 billion in the quarter, and loyalty and related revenue grew 19.2%.
- Debt is falling in a hard quarter. Debt and finance leases fell $1,101 million in three months to $12,851 million, and management plans to repay more than $2 billion in 2026.
- The operating business held its ground. Adjusted earnings per share were $1.72 against $1.70 a year ago, with fuel up 69%.
Bear Case
- The guide was missed by a wide margin. Adjusted earnings of $1.72 a share compare with July guidance of $2.00 to $2.50, and the operating margin of 9.4% with a guide of 11% to 13%.
- The full-year outlook was cut. The earnings range moved from $6.50–$7.50 to $5.10–$5.60, and free cash flow from $3–$4 billion to about $2.5 billion.
- Fuel is still rising. December-quarter guidance assumes about $4.25 a gallon, against $3.61 adjusted in the September quarter.
- Non-fuel costs are growing faster than capacity. Operating expense outside fuel and refinery rose 7.6% on flat seat miles, and salaries rose 8.5%.
- The refinery added cost this quarter. It ran a $33 million operating loss after an outage, and $416 million of hedge losses sit inside the fuel line.
- The demand language stops short of scarcity. Management describes demand as strong and broad. It does not say demand exceeds supply, and the capacity restraint is its own decision.
Our Take
The Q2 post leaned cautiously positive and named one thing to watch: fuel as a share of revenue holding above 20% without premium growth accelerating past 17%. Fuel was 21.6% of revenue. Premium grew 17.6%. That is a faster rate, and nowhere near enough to offset a fuel bill that grew 69%. The result is the lowest net margin in this ledger since FY2022 and a full-year guide cut by about a quarter. We read the quarter as a strong revenue business with a cost problem it does not control. The evidence for the first half is real: passenger revenue grew 15% with no added seats. The evidence for the second is in the same transaction, on the second expense line. Until the fuel ratio falls back below 20%, record revenue will keep arriving with falling profit, and the 10-Q says elevated fuel costs "are anticipated to persist until market disruptions and geopolitical events are resolved." The debt paydown is the part of the quarter we would weigh most heavily, because it is the decision management did control.