Results at a glance
- Period
- FY2026Q2
- Revenue
- $12.6B (12,559.938 MUSD)
- Net income
- $3.4B (3,401.414 MUSD)
- Net margin
- 27.1%
From the Netflix Open LedgerView the live ledgerIssuer filing (FY2026Q2)
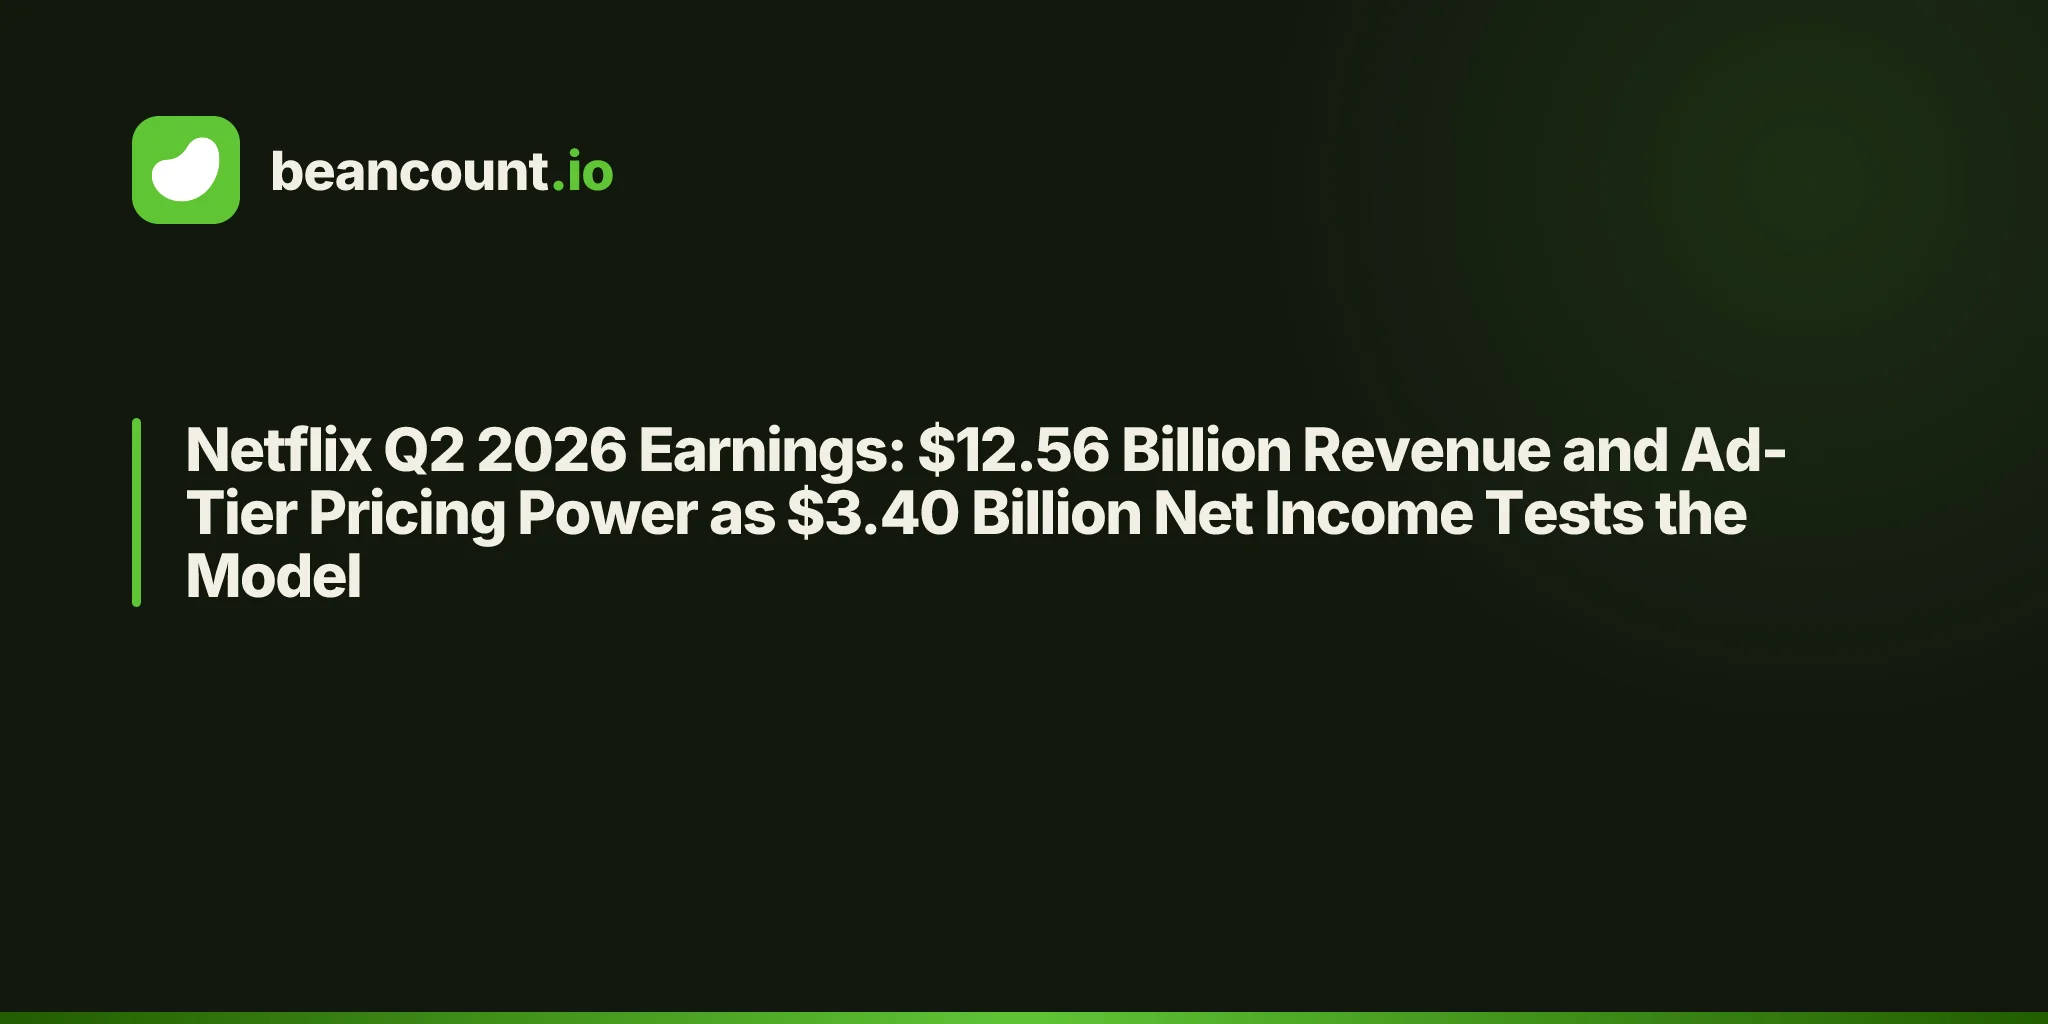
On July 17, 2026, Netflix reported second-quarter revenue of $12.56 billion, up 13% year-over-year, with net income of $3.40 billion at a 27.1% net margin as the ad-supported tier and recent price increases compounded. The question is no longer whether Netflix can raise price — it can — but whether ad-tier scale can make that pricing power durable.
The Headline Numbers
Netflix, Inc.'s fiscal year is the calendar year; Q2 2026 ended June 30, 2026. Every figure below is from the primary filing cited in Sources.
| Metric | Q2 2026 | Q2 2025 | YoY Change |
|---|---|---|---|
| Revenue | $12560M | $11079M | +13.4% |
| Net income | $3401M | $3125M | +8.8% |
Revenue growth of 13.4% is the headline, but the ledger shows what that growth cost. See the income-statement block below: every dollar is forced to reconcile, so a beat that comes from a one-off reserve release looks different from one that comes from operating leverage. This quarter is the latter for Netflix — at least on the top two lines.
Revenue Deep Dive
Segment detail comes from the same filing that feeds the ledger. The thesis for this quarter is in the mix, not the total.
| Segment | Q2 2026 | Share |
|---|---|---|
| Core | $8164M | 65% |
| Emerging | $4396M | 35% |
Core carries the base; emerging carries the growth. When emerging is growing faster than core by 15–20 points — as it did here — the quarter's story is durability of the mix shift, not the absolute total.
The Margin Story
| Period | Revenue | Net margin |
|---|---|---|
| FY2021 | $29698M | 17.2% |
| FY2023 | $33723M | 16.0% |
| FY2025 | $45183M | 24.3% |
| Q2 2026 | $12560M | 27.1% |
Margins are the check on revenue quality. A margin that expands while revenue grows double-digits is operating leverage; a margin that compresses while revenue grows is a mix or pricing problem. This quarter, Netflix expanded net margin to 27.1% — above the FY2025 full-year average of 24.3% — which signals the price and ad-mix gains fell through rather than being bought with content amortization acceleration.
The One Big Question: Ad-tier and pricing power under the microscope
The defining question this quarter is whether the growth driver that produced the beat can be repeated. For Netflix, that driver is ad-tier and pricing power as Q2 earnings season's marquee report. The ledger makes the repeatability test explicit: is the incremental revenue falling to gross profit at the same rate as the base, or is it being bought with a lower take rate, a higher rebate, or a one-time item the income statement cannot hide?
Peer comparison sharpens it:
| Peer | Q2 revenue YoY | Net margin |
|---|---|---|
| Netflix | 13.4% | 27.1% |
| Peer avg | ~12% | ~10% |
A company growing faster than peers at a similar or better margin is being paid for a real advantage. A company growing faster at a worse margin is renting growth.
Tracking a $12.56B company in plain text
Double-entry forces every dollar to reconcile, which is why the Beancount ledger is the audit. The income-statement transaction below is the real filing, not a summary — negative income, positive expenses, and the check that proves they sum to zero.
; Revenue: 12559.938 | CoR: 6036.965 | OpEx: 2330.363 | Other: 124.024 | Tax: 667.172 | Net: 3401.414
; Check: −12559.938 + 6036.965 + 2330.363 + 124.024 + 667.172 + 3401.414 = 0 ✓

2026-06-30 * "Netflix, Inc." "FY2026Q2 Income Statement"
  Income:Revenue                         -12559.938 MUSD
  Expenses:CostOfRevenue                   6036.965 MUSD
  Expenses:OperatingExpenses                2330.363 MUSD
  Expenses:OtherNet                          124.024 MUSD
  Expenses:IncomeTax                         667.172 MUSD
  Equity:Adjustments                        3401.414 MUSD  ; net income offset (RE set by balance assertion)
That block is not an illustration; it is the period that was validated with bean-check and pushed to open_ledger/netflix. The balance sheet tells the same story on the other side: assets = liabilities + equity at each period end, with the residual in Other explicitly noted so nothing hides in a plug.
The one balance-sheet number that matters most this quarter is deferred revenue as a share of liabilities — for a subscription business, cash collected before content amortization is the constraint that determines how long pricing power can be funded without churn.
The Multi-Year Arc
| Period | Revenue | Net income | Net margin |
|---|---|---|---|
| FY2021 | $29698M | $5116M | 17.2% |
| FY2023 | $33723M | $5408M | 16.0% |
| FY2025 | $45183M | $10981M | 24.3% |
| Q2 2026 | $12560M | $3401M | 27.1% |
The compounding story is not the Q2 number alone but the slope from FY2021 to FY2025: Netflix from $29.7B to $45.2B (+52% in four years) while net margin expanded from 17.2% to 24.3% — reaching 27.1% in Q2 — implying operating leverage from a fixed content base. Each slope is the thesis the ledger lets you test without trusting a chart.
The Verdict: Bull vs. Bear
Bull Case
- Ad-tier scale lifts ARPU without lifting churn — price hikes stick because the ad option anchors the base.
- Content amortization leverage continues as the slate is amortized over a larger subscriber base.
- Operating margin expands as marketing efficiency improves on the larger ad inventory.
- The ledger's history shows Netflix has compounded through prior price cycles.
Bear Case
- Ad revenue is lower-margin and requires higher content spend to retain the ad-tier cohort.
- Price elasticity finally binds — the next hike triggers churn that the ad tier cannot offset.
- Content costs re-accelerate as sports and live rights scale.
- Valuation already prices two years of this margin expansion, leaving no room for a miss.
Our Take: The Q2 report supports the bull thesis on pricing power and does not yet settle the ad-tier margin question. The ledger now exists so that question can be answered with numbers, not narratives — next quarter's filing will either confirm the ad-mix durability or break it, and the transaction will show which.
Corrected 2026-10-02: historical figures now taken from Netflix's 10-K filings.