Results at a glance
- Period
- FY2026Q3
- Revenue
- $218.1M (218.057 MUSD)
- Net income
- $28.9M (28.902 MUSD)
- Net margin
- 13.3%
From the Maxlinear Open LedgerView the live ledgerIssuer filing (FY2026Q3)
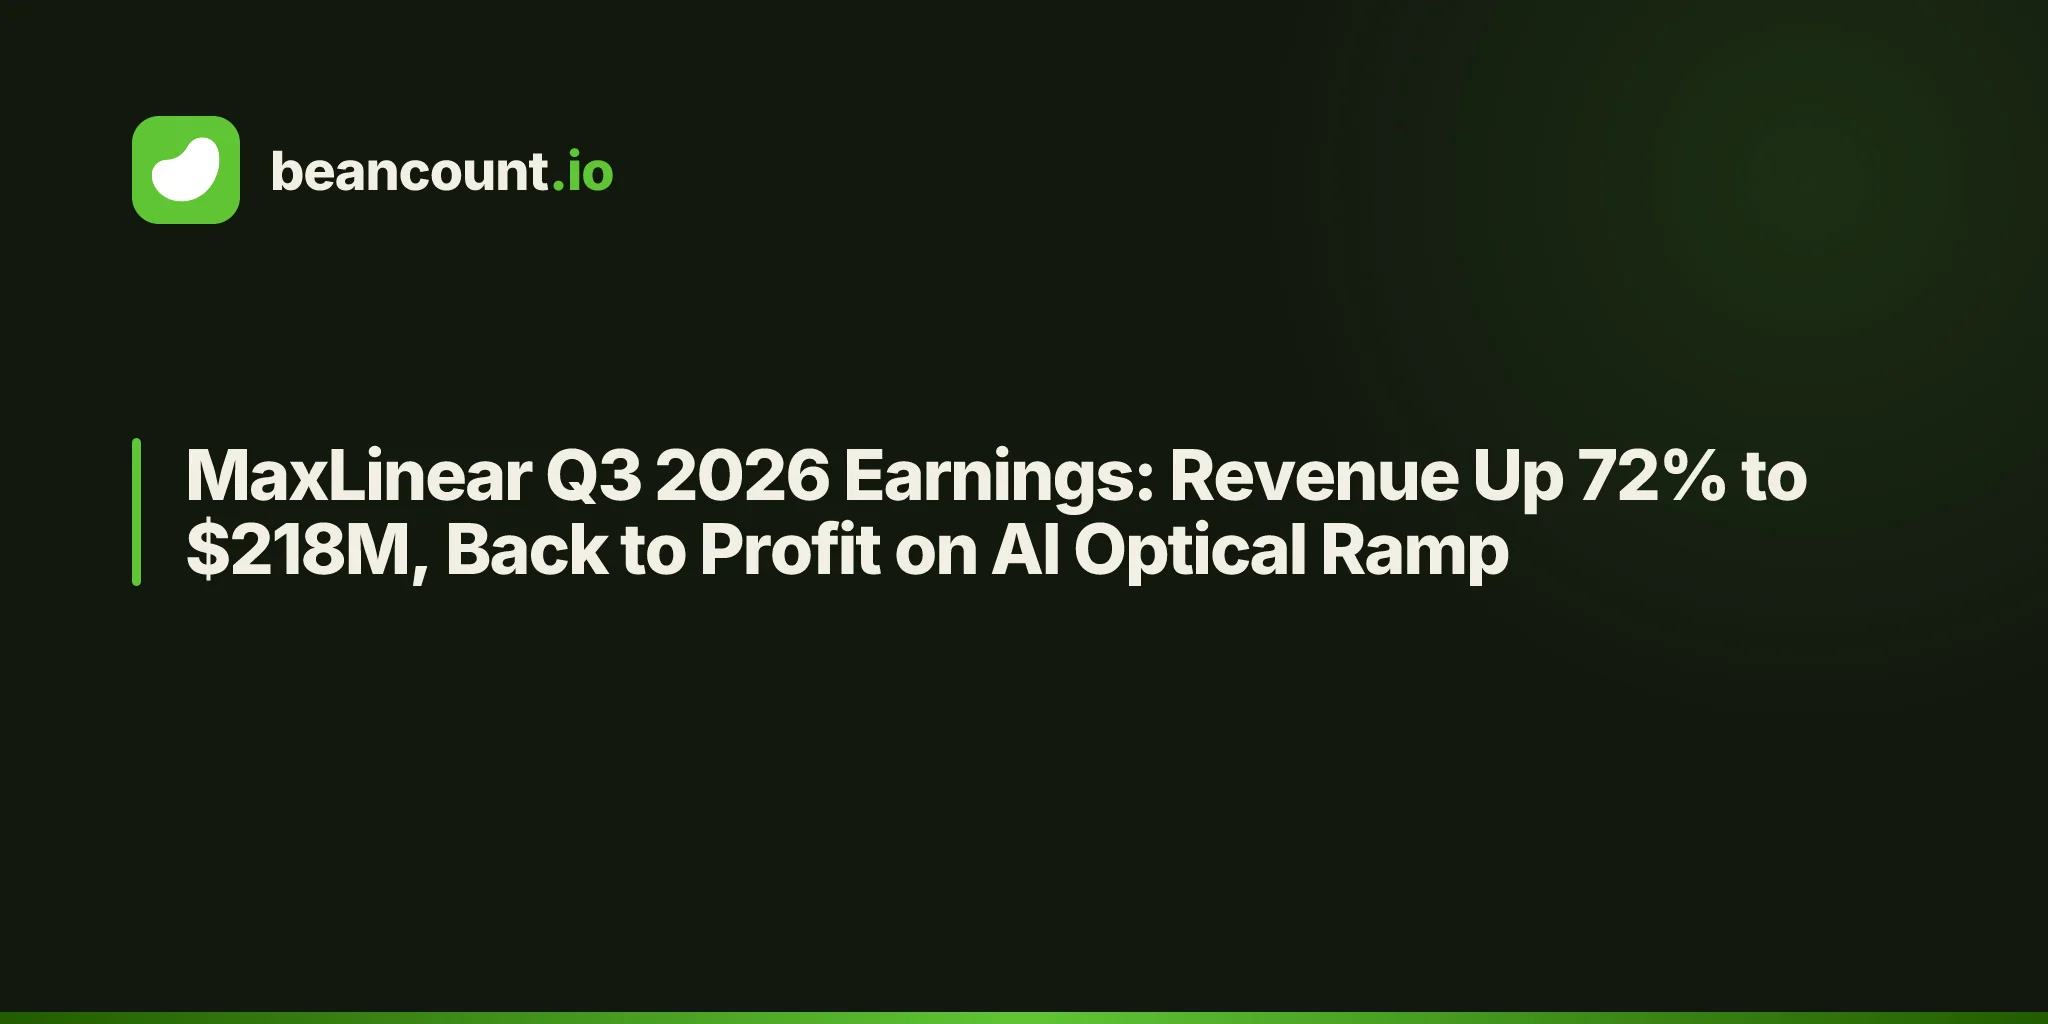
MaxLinear's third quarter is the inflection the last three years of losses were waiting for: net revenue of $218.1 million, up 72% year over year and 29% sequentially, with GAAP operating margin swinging from −32.7% to +13.9% and net income of $28.9 million — the second straight profitable quarter after a $1.8 million squeaker in Q2, and at 13.3% net margins a qualitatively different print. The driver is infrastructure revenue, up 210% on optical AI data-center products, now 57% of the company. This is a quarter about a business that finally looks like its thesis again.
The Headline Numbers
Every figure below comes from the Q3 2026 Form 10-Q and the earnings release. The Beancount fence models the quarter, so the headline table that gates it is Q3.
| Metric | Q3 FY2026 | Q3 FY2025 | YoY |
|---|---|---|---|
| Net revenue | $218.1M | $126.5M | +72.4% |
| Gross profit | $128.1M | $71.9M | +78.1% |
| Operating income | $30.2M | −$41.3M | return to profit |
| Net income | $28.9M | −$45.5M | return to profit |
| GAAP diluted EPS | $0.30 | −$0.52 | return to profit |
| Non-GAAP diluted EPS | $0.62 | $0.14 | +342.9% |
Revenue up 72% while GAAP operating expenses fell 14% to $97.8 million — that is the whole quarter in one sentence. Gross profit grew faster than revenue (+78%), operating leverage did the rest, and a $0.7 million tax benefit (against a $2.1 million provision last year) nudged the bottom line. Non-GAAP EPS of $0.62 nearly quintupled from $0.14, with stock comp ($19.8 million) and performance equity ($9.2 million) still the main bridge between the two EPS figures.
Revenue Deep Dive: Infrastructure Eats the Company
| End market | Q3 FY2026 | Share | Q3 FY2025 | YoY |
|---|---|---|---|---|
| Infrastructure | $124.9M | 57% | $40.3M | +209.6% |
| Broadband | $53.3M | 24% | $58.2M | −8.4% |
| Connectivity | $24.7M | 11% | $19.0M | +30.3% |
| Industrial and multi-market | $15.1M | 7% | $8.9M | +69.4% |
A year ago infrastructure was 32% of revenue and broadband was 46%. Now those shares have nearly flipped. CEO Kishore Seendripu: "Strong momentum in our optical AI data center business reflects the volume ramp of our Keystone PAM4 DSP platform, as well as the strength of our expanding infrastructure portfolio and customer activity centered around our Rushmore and Annapurna product families of 1.6T-capable optical and electrical products."
The release's demand language is explicit — "accelerated adoption of optical AI data center products," a "significant growth inflection underway" — and the balance sheet confirms a volume ramp rather than a channel fill: receivables up 59% year-to-date to $73.4 million and inventory up 46% to $113.7 million, both trailing the 72% revenue growth. Broadband, meanwhile, shrank 8% and is now a quarter of the company. The bull case requires not caring; the bear case starts here.
The Margin Story: From −33% to +14% in Four Quarters
| Margin | Q3 FY2026 | Q2 FY2026 | Q3 FY2025 |
|---|---|---|---|
| Gross (GAAP) | 58.7% | 57.8% | 56.9% |
| Operating (GAAP) | 13.9% | −2.5% | −32.7% |
| Net income | 13.3% | ~1.0% | −36.0% |
| Operating (non-GAAP) | 29.5% | 22.3% | 12.1% |
Gross margin expanded 180 basis points year over year to 58.7% — mix shift toward higher-value optical products, with non-GAAP gross margin at an even 60.0%. But gross is the sideshow: operating margin improved 4,660 basis points year over year because $91.6 million of incremental revenue arrived against an opex base that shrank $15.3 million. R&D actually grew 12% to $60.6 million (the company is still investing); the savings came from SG&A (down 22% to $36.9 million) and restructuring collapsing from $11.3 million to $0.3 million. This is operating leverage with the cost cuts already banked.
The One Big Question: Is the Optical Ramp Durable?
Everything about this quarter annualizes beautifully — until you ask what happens if AI data-center digestion pauses. Three falsifiable tripwires:
- The Q4 guide. Revenue $240–$260 million (+10–19% sequentially), GAAP gross margin 58–61%, opex $96–$101 million. A print below $240 million with stable opex breaks the leverage story immediately.
- Infrastructure mix. At 57% of revenue and +210%, infrastructure is MaxLinear now. If broadband's −8% spreads to connectivity while infrastructure decelerates below +100%, growth halves overnight.
- The balance-sheet build. Receivables (+59% YTD), inventory (+46%) and prepaid expenses (+141% to $121.6 million) all grew into the ramp. Healthy if Q4 ships; if days start stretching while revenue flattens, the ramp is becoming a stockpile.
One more thing to watch: the share count. Outstanding shares rose 5% year-to-date to 91.0 million and APIC rose $96.0 million on equity awards and stock comp — no offering, just the standing SBC machine ($67.3 million over nine months). At 29.5% non-GAAP operating margins the dilution is affordable; it still compounds against shareholders every quarter.
Tracking a $916 Million Company in Plain Text
A turnaround is the hardest story to verify from headlines — every "return to profit" needs a balance sheet that reconciles. Double-entry forces it: the $28.9 million of net income has to land in equity, and it does. This is how we model every company. The Q3 income statement, exactly as filed (income negative, expenses positive, net income absorbed by Equity:Adjustments):
; Check: −218.057 + 89.987 + 60.642 + 36.947 + 0.254 + 2.692 − 0.465 − 0.170 − 0.732 + 28.902 = 0 ✓
2026-09-30 * "MaxLinear, Inc." "FY2026Q3 Income Statement"
  Income:Revenue                                -218.057 MUSD  ; net revenue
  Expenses:CostOfRevenue                          89.987 MUSD  ; cost of net revenue
  Expenses:ResearchAndDevelopment                   60.642 MUSD  ; research and development
  Expenses:SellingGeneralAdministrative             36.947 MUSD  ; selling, general and administrative
  Expenses:OperatingExpenses                        0.254 MUSD  ; restructuring charges
  Expenses:OtherNet                                   2.692 MUSD  ; interest expense
  Income:OtherNet                                     -0.465 MUSD  ; interest income
  Income:OtherNet                                     -0.170 MUSD  ; other income, net
  Expenses:IncomeTax                                 -0.732 MUSD  ; income tax benefit
  Equity:Adjustments                                 28.902 MUSD  ; consolidated net income offset
The one balance-sheet number that tells the narrative: long-term debt rose $40.4 million year-to-date to $164.1 million while the Wells Fargo revolver was upsized $70 million to $200 million — the company is adding liquidity into strength, not distress.
The Multi-Year Arc
| Metric | FY2021 | FY2022 | FY2023 | FY2024 | FY2025 | Q3 FY2026 |
|---|---|---|---|---|---|---|
| Net revenue | $892.4M | $1,120.3M | $693.3M | $360.5M | $467.6M | $218.1M |
| Net income | $42.0M | $125.0M | −$73.1M | −$245.2M | −$136.7M | $28.9M |
| R&D spend | $278.4M | $296.4M | $269.5M | $225.2M | $208.6M | $60.6M |
The boom-bust-boom is stark: revenue peaked at $1.12 billion in FY2022, collapsed 68% to $360.5 million by FY2024, and Q3 annualizes to $872 million — nearly back to FY2021 levels in a single quarter's run-rate. Through the entire bust the company kept R&D above $200 million a year; that sustained bet is what the Keystone/Rushmore/Annapurna ramp is now monetizing. Cumulative 2023–2025 net losses were $455.0 million. Long-term debt fell from $306.2 million in FY2021 to $123.6 million at the end of FY2025, then rose $40.4 million in 2026 alongside the revenue recovery.
The Verdict: Bull vs. Bear
Bull Case
- 72% revenue growth with opex down 14% — textbook operating leverage, driving operating margin from −32.7% to +13.9% in one year.
- Infrastructure +210% to 57% of mix on named, ramping AI optical platforms (Keystone PAM4, Rushmore, Annapurna 1.6T) — share gains in the market's hottest segment.
- Second straight profitable quarter, with Q4 guided to $240–$260 million revenue at 58–61% gross margin — the ramp has a booked forward curve.
- Non-GAAP operating margin of 29.5% (up from 12.1%) shows the earnings power once SBC normalizes.
- Liquidity fortified into strength: revolver upsized to $200 million, cash up to $81.1 million, debt service trivial at $2.7 million quarterly interest.
Bear Case
- Broadband, the legacy core, shrank 8% to 24% of revenue — if the cycle turns there first, one leg of the stool is already shorter.
- The entire thesis is one end market at +210%: any AI digestion pause cuts the growth rate by two-thirds with no offset.
- $19.8 million of quarterly stock comp plus $9.2 million of performance equity is 13% of revenue — GAAP profitability stays hostage to SBC even at 29.5% non-GAAP margins.
- Receivables (+59%), inventory (+46%) and prepaids (+141%) all ballooned — a working-capital bill that comes due the quarter growth misses.
- Q3 annualizes to $872 million against a $1.12 billion FY2022 peak — the stock likely prices the full recovery while revenue is still 22% below the top.
Our Take: The inflection is real, and the numbers confirm it six ways — but this is now a momentum position, not a value one. The 210% infrastructure ramp, the banked cost cuts and the booked Q4 guide justify owning the turn; the single-market concentration, the working-capital build and the broadband decay argue for sizing it as one. Watch the Q4 revenue print and the receivables line before anything else.