Results at a glance
- Period
- FY2026Q3
- Revenue
- $184M (184 MUSD)
- Net income
- $21.6M (21.6 MUSD)
- Net margin
- 11.7%
From the Knowles Open LedgerView the live ledgerIssuer filing (FY2026Q3)
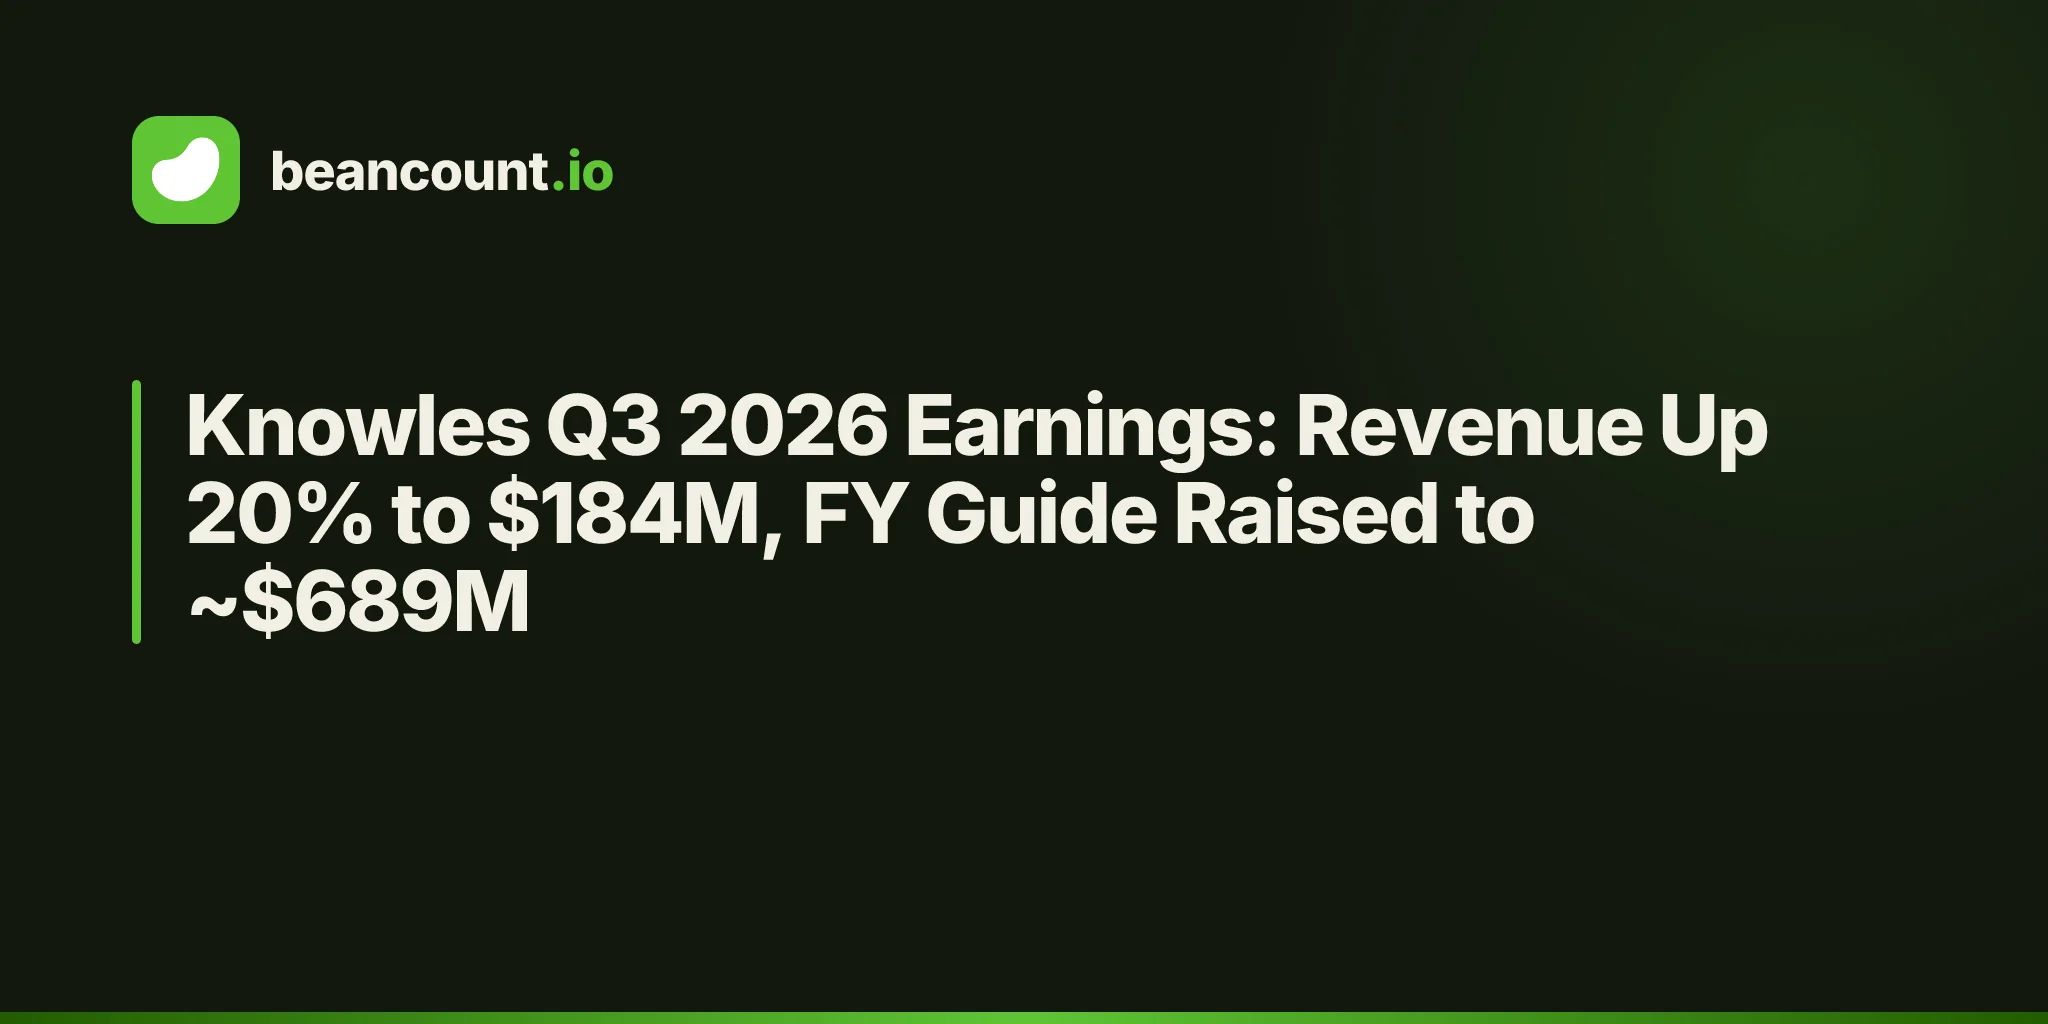
Knowles Corporation (NYSE: KN), the Itasca, Illinois maker of precision acoustic and electronic components, reported third-quarter 2026 revenue of $184.0 million, up 20% year over year and above the high end of its guidance range. Non-GAAP diluted earnings per share came in at $0.38 against $0.33 a year ago, operating cash flow surged 53% to $44.6 million, and management's fourth-quarter guide implies full-year 2026 revenue of about $689 million — 16% growth over 2025.
The number management led with isn't on the income statement at all: the book-to-bill ratio in Precision Devices stayed above one for the eighth consecutive quarter. Two years of orders outrunning shipments is the stock's entire bull case in one sentence. The bear case is in the same release: gross margin compressed 1.5 points while volumes surged, and the fourth-quarter revenue guide is essentially flat sequentially. This post walks through both, against five periods of ledger history.
The Headline Numbers
| Metric | Q3 2026 | Q2 2026 | Q3 2025 |
|---|---|---|---|
| Revenue | $184.0M | $166.8M | $152.9M |
| Gross profit (margin) | $81.3M (44.2%) | $74.6M (44.7%) | $69.9M (45.7%) |
| Non-GAAP gross margin | 45.3% | 45.4% | 46.2% |
| GAAP diluted EPS (continuing) | $0.24 | $0.21 | $0.21 |
| Non-GAAP diluted EPS | $0.38 | $0.33 | $0.33 |
| Operating cash flow | $44.6M | $28.2M | $29.1M |
Revenue grew 20.3% year over year and 10.3% sequentially. Net earnings were $21.6 million, of which $21.2 million came from continuing operations and $0.4 million from discontinued operations. For the fourth quarter, Knowles guided revenue of $180–190 million, GAAP diluted EPS of $0.31–0.35, non-GAAP diluted EPS of $0.39–0.43, and operating cash flow of $60–70 million. At the $185 million revenue midpoint, the fourth quarter is guided roughly flat against the $184.0 million just printed — the tension at the heart of this quarter, and the subject of the Big Question below.
Where the Growth Came From: Four Markets, One Order Book
CEO Jeffrey Niew credited "strong growth across the four major markets we serve: Medtech, Defense, Industrial, and Electrification," driven by custom products developed with customers and scaled on Knowles' manufacturing base. The release gives no segment revenue split, so shareholders cannot see which of the four did the work — but the breadth claim matters because Medtech and Defense demand is stickier and less cyclical than the consumer-electronics volumes Knowles spent a decade trying to escape.
The escape is now complete, and the ledger shows how large it was. Knowles sold its Consumer MEMS Microphones (CMM) business to Syntiant Corp. on December 27, 2024. Before the restatement, fiscal 2022 revenue was reported as $764.7 million; the restated continuing-operations figure is $478.8 million. The divested business was well over a third of the old reported top line. Every year-over-year comparison in this post uses the restated continuing-operations figures — the only like-for-like basis that exists.
The other inorganic layer is Cornell Dubilier, the capacitor maker acquired November 1, 2023 for $259.8 million and folded into Precision Devices. Its first full year inside Knowles is a large part of why fiscal 2024 revenue jumped 21%.
The Multi-Year Arc: Two Loss Years, Then a Clean Print
| Fiscal year | Revenue | Net earnings |
|---|---|---|
| FY2022 | $478.8M | −$430.1M |
| FY2023 | $456.8M | +$72.4M |
| FY2024 | $553.5M | −$237.8M |
| FY2025 | $593.2M | +$44.2M |
| 9M 2026 | $503.9M | +$80.6M |
Read the income statement, not the bottom line: both loss years are discontinued-operations stories. Fiscal 2022's −$430.1 million includes a −$496.5 million discontinued loss (the CMM write-down) against +$66.4 million from continuing operations. Fiscal 2023 earned +$72.4 million. Fiscal 2024's −$237.8 million includes a −$261.2 million discontinued loss on the CMM sale against +$23.4 million from continuing operations. Fiscal 2025 is the first clean year of the new Knowles: +$44.2 million on $593.2 million of revenue, with continuing operations contributing +$37.5 million.
Nine months into 2026, revenue of $503.9 million is already 85% of full-year 2025, and net earnings of $80.6 million are 1.8× the whole of last year. The trajectory is unambiguous; the question is its quality, which brings us to margins and the balance sheet.
One comparability warning for ledger readers: the fiscal 2022 balance sheet in our ledger is as originally filed (pre-reclassification), while all income statements use the restated continuing-operations versions. The ledger's main file carries the full banner.
The Balance Sheet: Delevered, With a Dividend-Paying Souvenir
Total equity stood at $1,070.4 million on September 30, 2026, up 3% from $1,039.7 million at year-end 2025 — about $12.11 per share outstanding. Long-term debt of $129.2 million is down 26% from $174.7 million at the end of fiscal 2022; cash sits at $122.6 million. This is a company that shrank its revenue base by a third through divestiture and used the proceeds to de-risk the balance sheet rather than chase deals.
The CMM sale left one unusual asset behind: an $83.4 million equity investment in the buyer, Syntiant Corp., which paid Knowles $6.2 million in dividends in fiscal 2025. Niew sits on Syntiant's board, and Knowles leases former CMM facility space back to the buyer. It is a tidy arrangement — a dividend stream from the business you exited — but it also means $83.4 million of shareholder capital rides on a private company's fortunes, disclosed at fair value with no public quote to check it against.
A filing note: as of this writing Knowles has filed no 10-Q for the quarter, so the balance sheet above comes from the earnings release's unaudited statements. The ledger will be updated against the 10-Q when it files.
The One Big Question: Is Eight Quarters of Book-to-Bill Above One a Supercycle or a Channel Filling Up?
The bull case writes itself. Eight consecutive quarters of Precision Devices orders exceeding shipments, spread across four end markets including defense and medtech, with revenue growth accelerating from 7% last year to 20% this quarter and operating cash flow up 53%. Management is confident enough to guide full-year revenue growth of 16%. That is what a demand supercycle looks like.
The bear case is three lines in the same release. First, GAAP gross margin fell to 44.2% from 45.7% a year ago (non-GAAP: 45.3% versus 46.2%) — the growth is volume, not price or mix, and something in the mix is diluting. Second, the fourth-quarter revenue guide is flat sequentially at the midpoint despite the record order streak: eight quarters of orders outrunning shipments should compound into backlog and accelerating shipments, so a flat guide says either capacity is constrained (bullish) or orders are normalizing (bearish), and the release does not say which. Third, the cyclical history: revenue declined in fiscal 2023, and two of the last four years printed net losses, however discontinued-flavored. Industrial and defense cycles turn too.
The tell is the fourth-quarter print against the $180–190 million range. A beat at the top end with a ninth straight book-to-bill above one confirms the supercycle; a print at the low end with margin compression continuing says the channel spent 2026 filling up. Watch those two numbers before anything else.
Tracking a $1.1 Billion Balance Sheet in Plain Text
A divestiture this large is where double-entry earns its keep: the CMM business had to leave the balance sheet somewhere, and the ledger shows exactly where it went — discontinued lines run to zero while an $83.4 million Syntiant stake and its dividend stream appear in their place. This is how we model every company. The Q3 income statement, exactly as filed (income negative, expenses positive, net income absorbed by Equity:Adjustments):
; Check: −184.0 + 102.2 + 0.5 + 11.1 + 39.4 + 0.1 + 1.6 + 1.3 + 6.6 − 0.4 + 21.6 = 0 ✓
2026-09-30 * "Knowles Corporation" "FY2026Q3 Income Statement"
  Income:Revenue                                -184.0 MUSD  ; revenues
  Expenses:CostOfRevenue                         102.2 MUSD  ; cost of goods sold
  Expenses:CostOfRevenue                           0.5 MUSD  ; restructuring charges - cost of goods sold
  Expenses:ResearchAndDevelopment                   11.1 MUSD  ; research and development expenses
  Expenses:SellingGeneralAdministrative             39.4 MUSD  ; selling and administrative expenses
  Expenses:OperatingExpenses                        0.1 MUSD  ; restructuring charges
  Expenses:OtherNet                                   1.6 MUSD  ; interest expense, net
  Expenses:OtherNet                                   1.3 MUSD  ; other expense, net
  Expenses:IncomeTax                                 6.6 MUSD  ; provision for income taxes
  Income:OtherNet                                     -0.4 MUSD  ; earnings from discontinued operations, net
  Equity:Adjustments                                 21.6 MUSD  ; consolidated net earnings offset
The one balance-sheet number that tells the narrative: long-term debt fell from $174.7 million to $129.2 million across the divestiture years while equity held above $1 billion — the CMM exit, visible as a single risk-off rotation.
The Verdict: Bull vs. Bear
Bull Case
- Eight consecutive quarters of Precision Devices book-to-bill above one across four end markets — two years of demand evidence, not one quarter.
- Revenue up 20% year over year and above the high end of guidance, with full-year growth guided to 16% (~$689 million).
- Operating cash flow up 53% to $44.6 million, with $60–70 million guided for Q4 — the earnings are cash-backed.
- The balance sheet de-risked through the transition: debt down 26% since FY2022, equity above $1 billion, $122.6 million of cash.
- Nine-month net earnings of $80.6 million already 1.8× full-year 2025 — operating leverage is showing up.
Bear Case
- Gross margin compressed 1.5 points year over year (44.2% vs. 45.7%) while volumes surged — growth without pricing power.
- Q4 revenue guided flat sequentially ($185 million midpoint vs. $184.0 million) despite the record order streak — either capacity-capped or normalizing, undisclosed which.
- No segment revenue disclosure: shareholders cannot verify which of the four markets is actually growing.
- $83.4 million of equity tied up in a private Syntiant stake with no public quote — a related-party-flavored asset (CEO on the board, lease-back tenant).
- Cyclical history: an FY2023 revenue decline and two net-loss years in the last four; the restated base flatters every growth rate.
Our Take: Underwrite the order book, not the growth rate. Eight quarters of book-to-bill above one is the real asset here, and the cash flow backs it — but a flat Q4 guide and compressing margins say this demand is volume at market prices, not pricing power. The fourth-quarter print against $180–190 million and the ninth book-to-bill reading decide whether Knowles is compounding or cresting. Watch those before anything else.