Results at a glance
- Period
- FY2026Q3
- Revenue
- $8.4B (8,422 MUSD)
- Net income
- $270M (270 MUSD)
- Net margin
- 3.2%
From the Southwest Airlines Open LedgerView the live ledgerIssuer filing (FY2026Q3)
Southwest Airlines reported September-quarter operating revenue of $8.4 billion on October 21, 2026, up 21.2% to a third-quarter record, and quintupled net income to $270 million. Then it cut its full-year adjusted earnings guide to $2.60–$2.85 a share from $3.25–$4.25, because jet fuel at $3.92 a gallon — rising to an assumed $4.55 in the fourth quarter — is eating the transformation story alive.
The Headline Numbers
Southwest's fiscal year is the calendar year, so the third quarter of 2026 is the three months ended September 30, 2026. Every figure below comes from the Form 10-Q, filed October 22, and the earnings release from the day before.
| Metric | Q3 2026 | Q3 2025 | YoY Change |
|---|---|---|---|
| Revenue | $8,422M | $6,949M | +21.2% |
| Operating income | $379M | $35M | +$344M |
| Pre-tax income | $355M | $68M | +$287M |
| Net income | $270M | $54M | +$216M |
| Fuel expense | $2,152M | $1,331M | +61.7% |
| Diluted EPS | $0.55 | $0.10 | +$0.45 |
| Operating margin | 4.5% | 0.5% | +4.0 pts |
| Net income, excluding special items (non-GAAP) | $328M | $58M | +$270M |
| Adjusted diluted EPS (non-GAAP) | $0.66 | $0.11 | +$0.55 |
Revenue grew $1,473 million and operating income grew $344 million — a 23% incremental margin, which is what operating leverage is supposed to look like. Fuel expense grew $821 million, consuming 56% of the revenue gain, and the company still expanded operating margin by 4 full points. That is the bull thesis in one paragraph: the new Southwest prices so far above the old one that even 63% fuel inflation leaves margin expansion.
The adjusted net income of $328 million strips $73 million of pre-tax special items — $30 million of impairments on assets no longer in use, $13 million of litigation accruals, $30 million of severance — less a $16 million tax effect. Adjusted EPS of $0.66 landed in the upper half of the $0.50–$0.75 third-quarter guide from July.
Revenue Deep Dive
Passenger revenue did the work, and the transformation initiatives decided where inside passenger revenue it landed.
| Revenue line | Q3 2026 | Q3 2025 | YoY Change |
|---|---|---|---|
| Passenger | $7,754M | $6,313M | +22.8% |
| Freight | $48M | $42M | +14.3% |
| Other | $621M | $594M | +4.5% |
| Total | $8,422M | $6,949M | +21.2% |
The 10-Q splits passenger revenue three ways, and the split is the story:
| Passenger mix | Q3 2026 | Q3 2025 | YoY Change |
|---|---|---|---|
| Non-loyalty | $6,122M | $4,896M | +25.0% |
| Loyalty — air transportation | $734M | $805M | −8.8% |
| Ancillary sold separately | $898M | $612M | +46.7% |
Ancillary revenue — bag fees, assigned seating, extra legroom — grew 46.7% to $898 million, contributing $286 million of the $1,441 million passenger gain. This is the monetization of the two most controversial decisions in company history: charging for checked bags starting mid-2025 and introducing assigned and extra-legroom seating on January 27, 2026. Nine-month ancillary of $2,489 million already exceeds any plausible full prior year (nine-month 2025 was $1,166 million). The transformation is complete, in management's words, and this line is the receipt.
Management's demand language earns a robust-demand verdict but nothing stronger. CEO Bob Jordan: "Demand remained strong as we lapped last year's bag fee and other commercial initiatives, reinforcing our belief that the earnings power we've built is durable, even with significantly higher fuel costs." And on the current quarter: "Robust demand has continued in the fourth quarter." Corporate backs it up — managed business revenue hit a third-quarter record, with 20 of the 50 all-time top booking days falling in the quarter — and unit revenue of 18.55 cents per seat mile beat the 17.5–19.5% guide at +21.6%.
But the release never says demand exceeds supply, and the operating statistics explain the restraint. Capacity fell 0.4%, traffic fell 0.4%, revenue passengers carried fell 3.2%, and load factor sat flat at 79.8%. Average fare jumped 26.9% to $231.69 and yield jumped 23.3% to 21.41 cents. Fewer people boarded; each paid far more. Pricing power, not full planes — the same yield-not-volume pattern as American, and it means the revenue record is one demand wobble away from a volume problem.
The Margin Story
Fuel redrew the cost structure, and everything else leveraged down around it.
| Cost line | Q3 2026 | Share of revenue | Q3 2025 | Share of revenue |
|---|---|---|---|---|
| Salaries, wages and benefits | $3,542M | 42.1% | $3,219M | 46.3% |
| Aircraft fuel | $2,152M | 25.6% | $1,331M | 19.2% |
| Maintenance | $303M | 3.6% | $299M | 4.3% |
| Landing fees and airport rentals | $623M | 7.4% | $548M | 7.9% |
| Depreciation and amortization | $398M | 4.7% | $394M | 5.7% |
| Other operating | $1,026M | 12.2% | $1,123M | 16.2% |
Fuel took 6.4 more cents of every revenue dollar than a year ago: $3.92 a gallon, up 63.3%, on 1.1% fewer gallons burned. The release quantifies the damage precisely — fuel added $821 million year over year and represented a $1.08 headwind to adjusted EPS, meaning ex-fuel adjusted EPS would have been roughly $1.74. Every other line leveraged down as a share of revenue, with other operating expenses falling a full 4 points on an absolute decline of $97 million. That is a fixed-cost business doing its job on 21% revenue growth.
The ex-fuel cost story is solid rather than spectacular. CASM-X — unit costs excluding fuel, special items and profit sharing — rose 3.8% to 12.68 cents on 0.4% less capacity, and nominal ex-fuel costs rose 3.4%. For calibration, American's CASM-ex rose 3.0% with capacity up 4.2%, so Southwest is not leading the industry on cost control. But it doesn't need to: with RASM up 21.6%, the 17.8-point spread between unit revenue and unit cost growth is the widest in the group.
| Margin | Q3 2025 | FY2024 | FY2025 | Q3 2026 |
|---|---|---|---|---|
| Operating margin | 0.5% | 1.2% | 1.5% | 4.5% |
| Net margin | 0.8% | 1.7% | 1.6% | 3.2% |
The margin progression reframes the whole company. Southwest earned 1–2% operating margins in 2024 and 2025 — worse than a grocery chain. The 4.5% this quarter is triple last year's full-year margin, achieved against the worst fuel tape in company history. Pricing power did that: yield up 23.3% while volumes shrank.
The One Big Question: What Survives $4.55 Fuel?
The quarter is history; the guidance cut is the trade. In July, Southwest guided full-year adjusted EPS of $3.25–$4.25 — itself a cut from "at least $4.00." October's guide is $2.60–$2.85. The midpoint fell 27% in three months, and the entire new range sits below the old midpoint.
| 2026 adjusted EPS guide | Low | High | Midpoint |
|---|---|---|---|
| July guide | $3.25 | $4.25 | $3.75 |
| October guide | $2.60 | $2.85 | $2.73 |
| Change | −$0.65 | −$1.40 | −27% |
The arithmetic closes cleanly. Nine-month adjusted EPS is $2.05, and the fourth-quarter guide is $0.55–$0.80 — which sums to exactly $2.60–$2.85. The culprit is the fuel line: Q4 fuel is assumed at approximately $4.55 a gallon on the October 15 forward curve, 16% above Q3's $3.92 and roughly double a normal price. At 548 million gallons a quarter, every $0.10 of fuel is about $55 million of pre-tax income — the guide cut's $1.02 midpoint drop in adjusted EPS is, efficiently, the fuel curve.
The GAAP to non-GAAP bridge shows how little of the quarter's profit is adjusted away:
| GAAP → non-GAAP bridge, Q3 2026 | USD millions |
|---|---|
| Net income, as reported | $270M |
| Add: impairment of long-lived assets | $30M |
| Add: litigation accruals | $13M |
| Add: severance and related costs | $30M |
| Less: tax effect of special items | −$16M |
| Net income, excluding special items | $328M |
Special items added $58 million net ($73 million pre-tax) — 18% of adjusted profit — a real add-back, but the quarter is profitable on any basis, which separates Southwest from American. (The bridge lines above sum to $327M against the filed $328M total — $1M of filing rounding.) The peer table makes the fuel shock legible across all four network carriers:
| Q3 2026 peer | Revenue (YoY) | Fuel (YoY) | Net income | Op margin |
|---|---|---|---|---|
| Southwest | $8,422M (+21.2%) | $2,152M (+61.7%) | $270M | 4.5% |
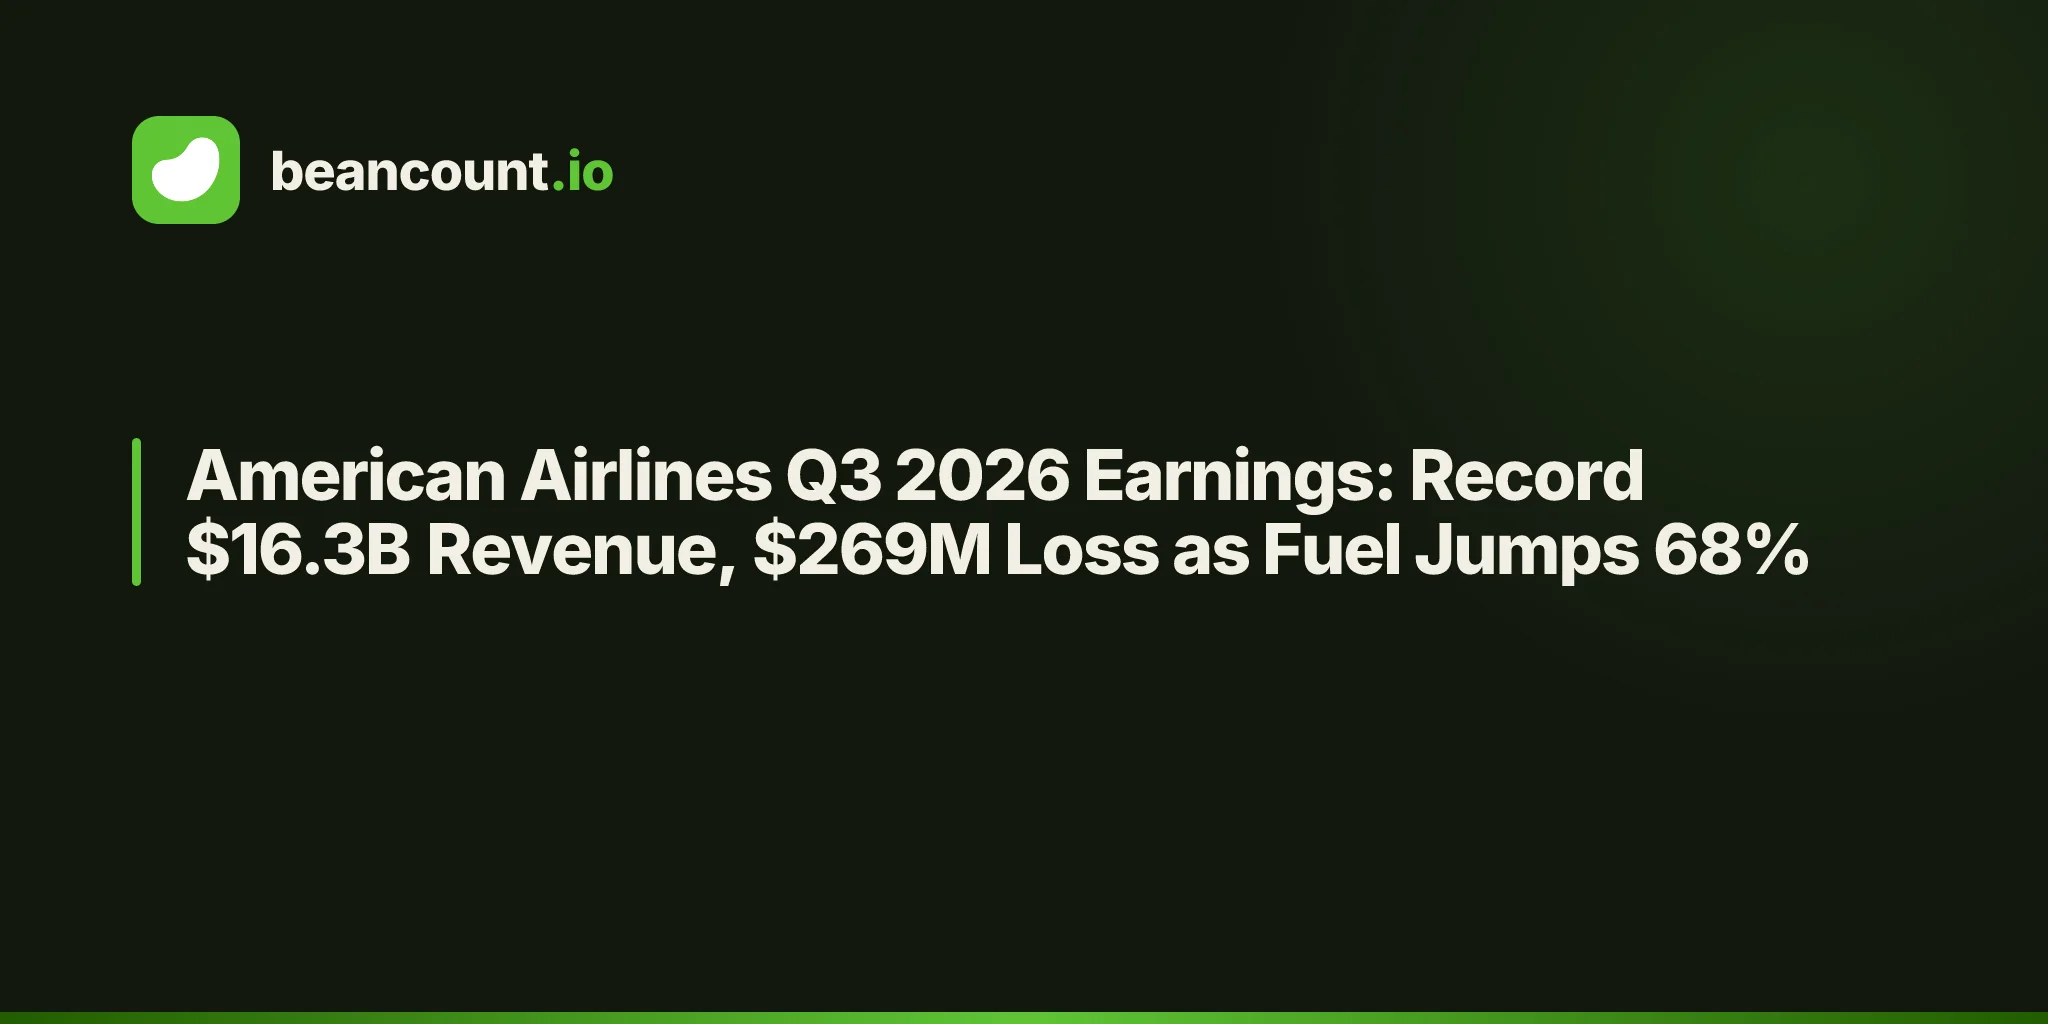
| American | $16,335M (+19.3%) | $4,635M (+67.5%) | −$269M | 0.7% |
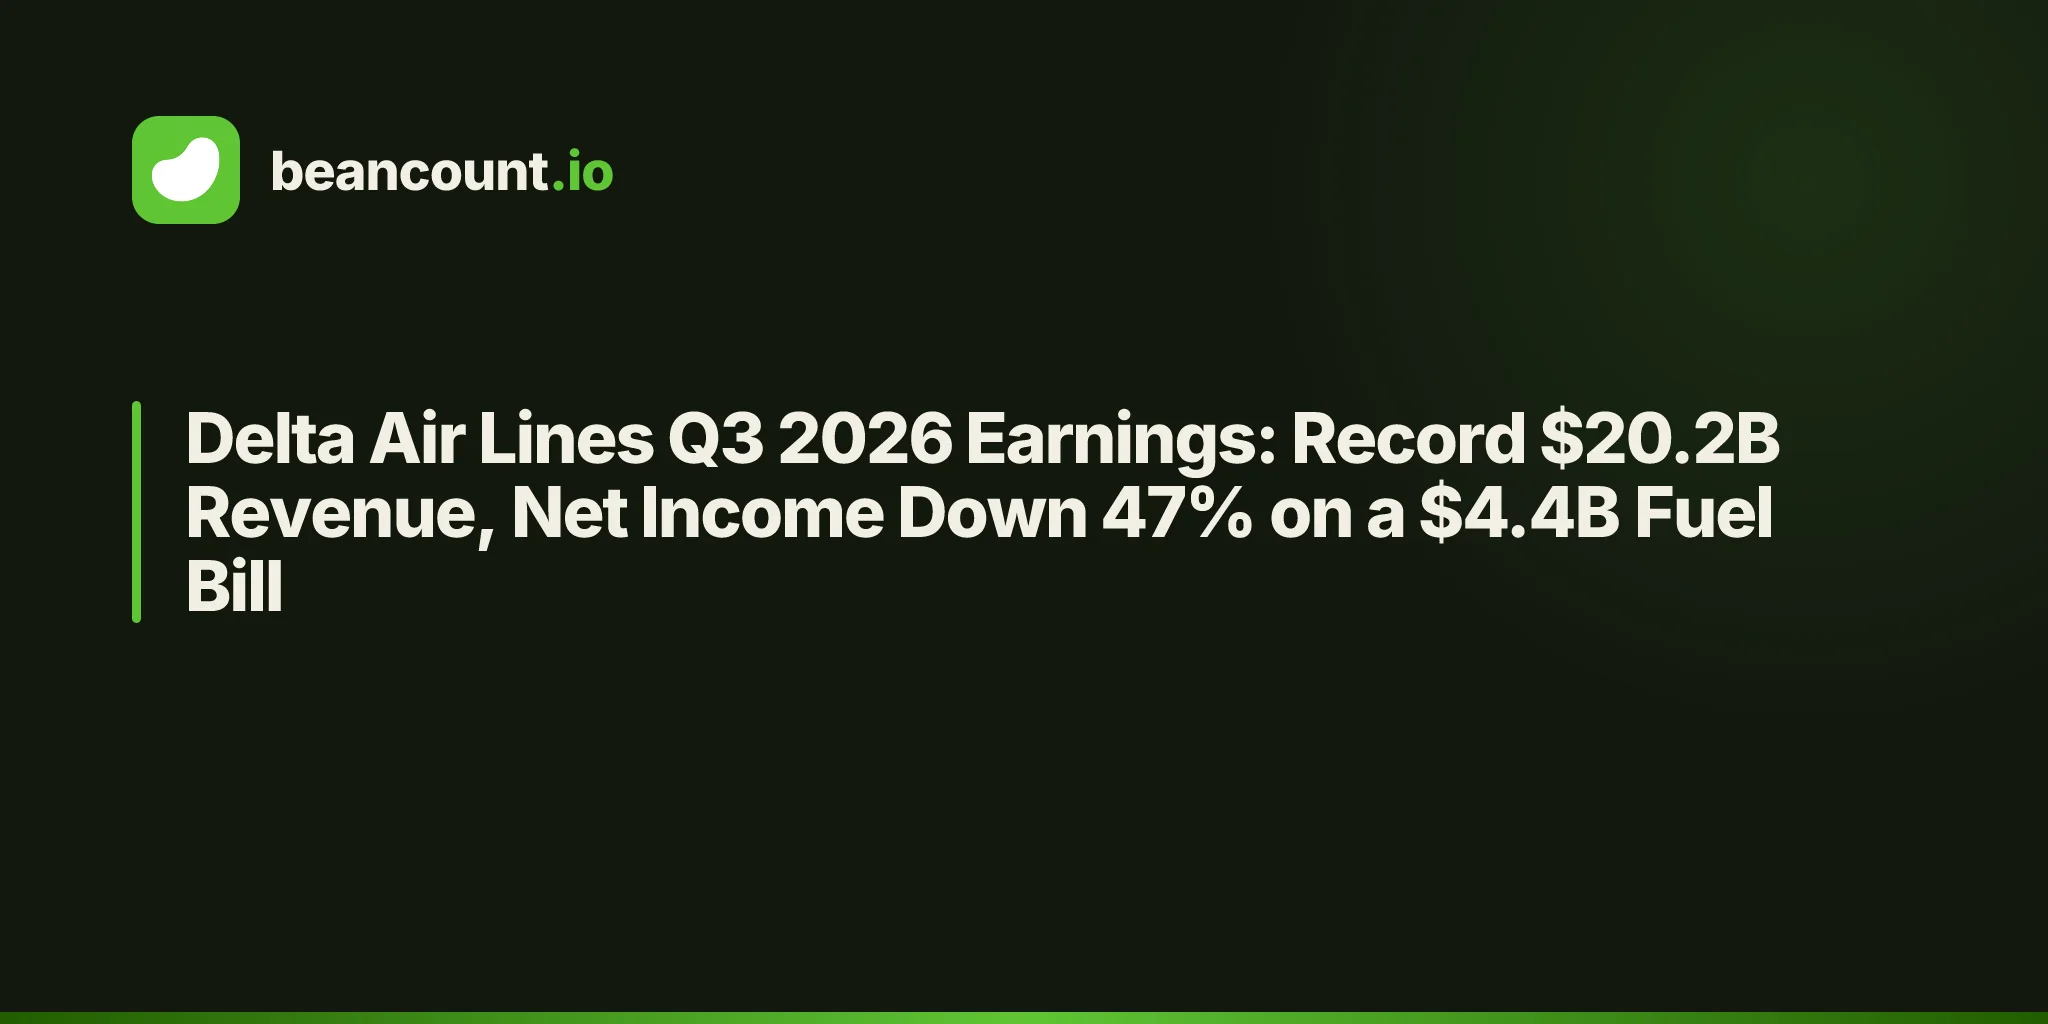
| Delta | $20,186M (+21.1%) | $4,351M (+69.3%) | $756M | 7.2% |
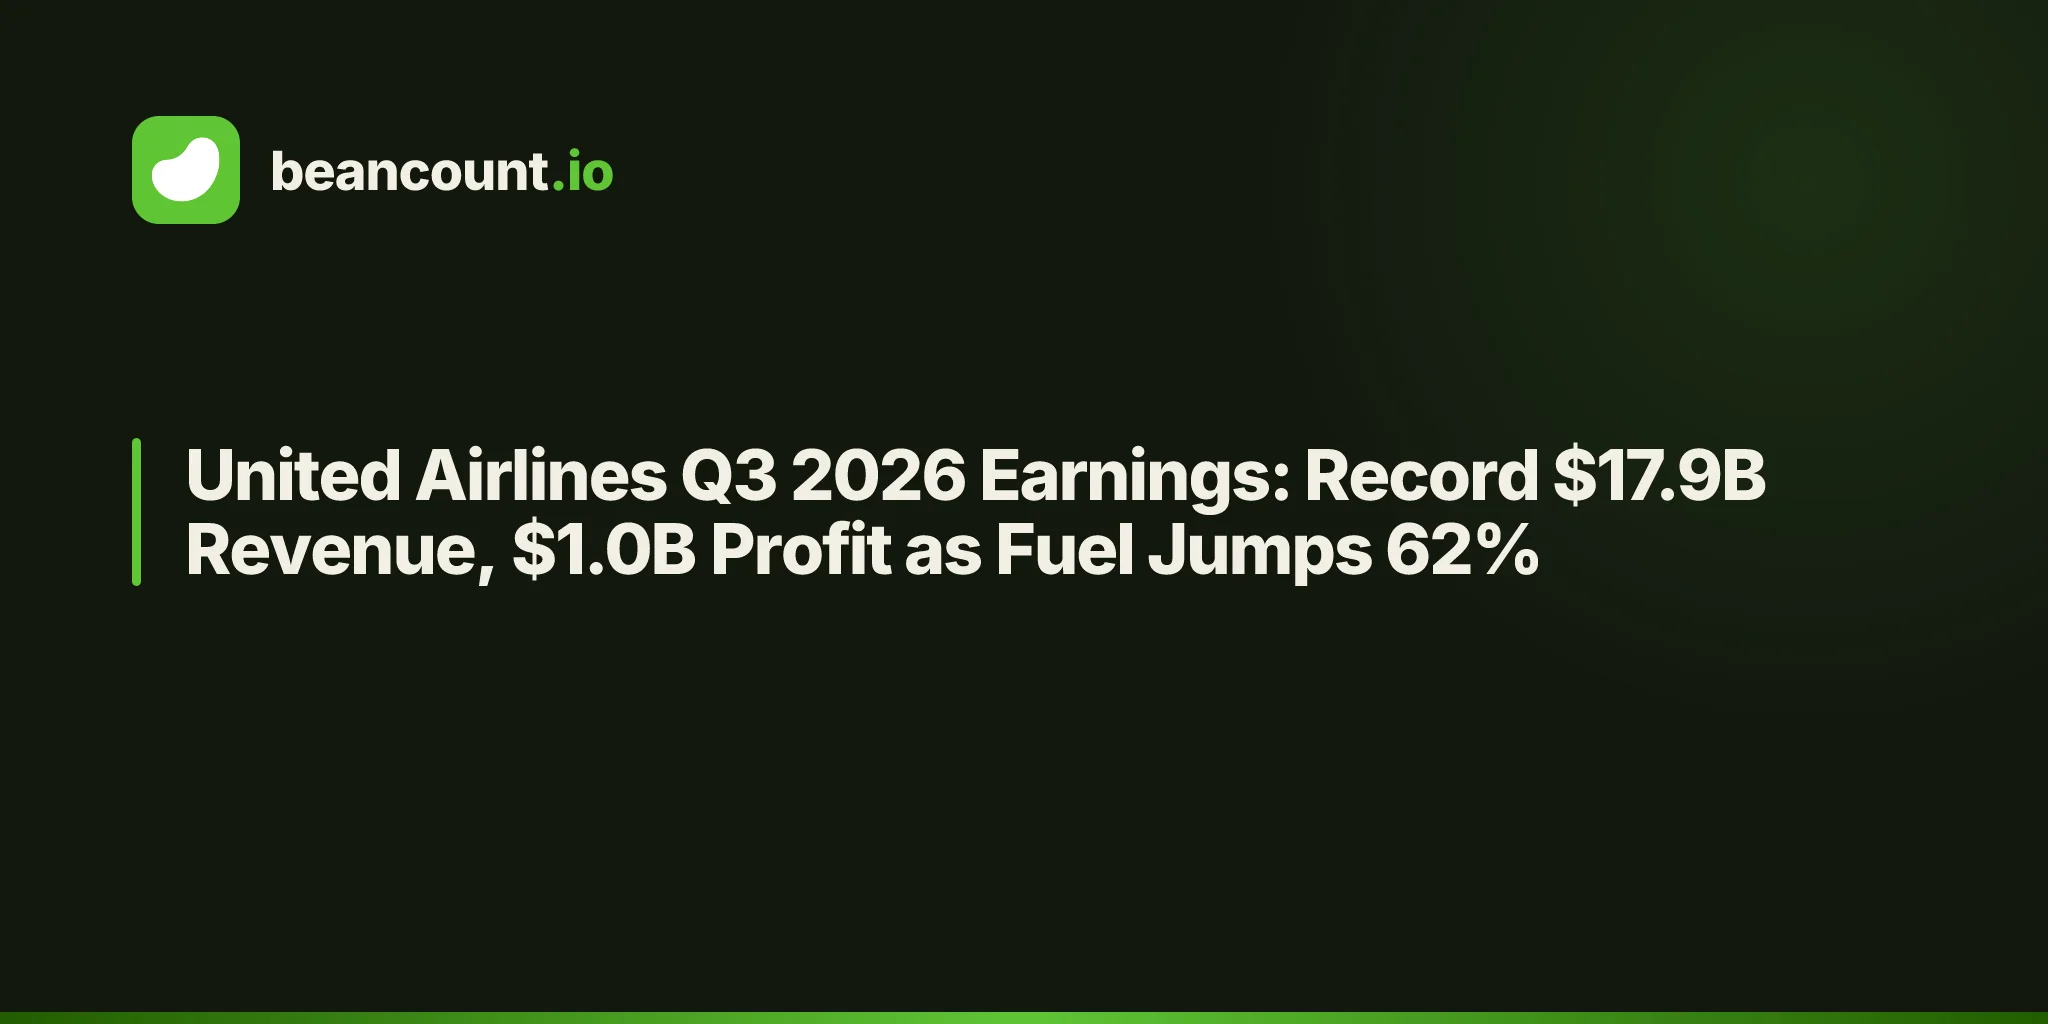
| United | $17,875M (+17.4%) | $4,843M (+61.6%) | $1,029M | 8.1% |
Southwest matched Delta on revenue growth, paid a milder fuel increase than Delta or American, and still earns barely half United's margin. The gap is starting position: Southwest entered the shock at 1.5% operating margin, so even record pricing only rebuilds to 4.5%. The question for Q4 is whether RASM guidance of +19–21% on capacity up 3–4% can outrun $4.55 fuel the way +21.6% on flat capacity outran $3.92. Management is guiding that it can — barely, at $0.55–$0.80 against Q3's $0.66.
Tracking an $8.4B Quarter in Plain Text
Double-entry bookkeeping forces every dollar to reconcile, which is exactly what an earnings release full of adjusted figures resists. Modeling Southwest in Beancount pins the filed numbers — revenue, every expense line, the debt wall — in one zero-sum transaction, so the story above can be checked line by line. This is how we model every company.
; FY2026Q3 Income Statement — three months ended 2026-09-30
; Check: −8,422 + 3,542 + 2,152 + 303 + 623 + 398 + 1,026 + 70 − 13 − 33 − 1 + 85 + 270 = 0 ✓

2026-09-30 * "Southwest Airlines Co." "FY2026Q3 Income Statement"
  Income:Revenue                         -8,422 MUSD  ; passenger 7,754 + freight 48 + other 621
  Expenses:CostOfRevenue                    3,542 MUSD  ; salaries, wages, and benefits
  Expenses:CostOfRevenue                    2,152 MUSD  ; aircraft fuel and related taxes ($3.92/gal, +63.3% YoY)
  Expenses:CostOfRevenue                      303 MUSD  ; maintenance materials and repairs
  Expenses:CostOfRevenue                      623 MUSD  ; landing fees and airport rentals
  Expenses:CostOfRevenue                      398 MUSD  ; depreciation and amortization
  Expenses:CostOfRevenue                    1,026 MUSD  ; other operating expenses
  Expenses:OtherNet                            70 MUSD  ; interest expense
  Income:OtherNet                             -13 MUSD  ; capitalized interest
  Income:OtherNet                             -33 MUSD  ; interest income
  Income:OtherNet                              -1 MUSD  ; other gains, net
  Expenses:IncomeTax                           85 MUSD  ; provision for income taxes
  Equity:Adjustments                          270 MUSD  ; net income offset (RE set by balance assertion)
(Beancount sign convention: Income is negative, Expenses positive, and the transaction sums to zero.)
The one balance-sheet number that tells the narrative is the $2,153 million of current maturities of long-term debt — up from $324 million at year-end, a 6.6-fold jump as a wall of maturities moved inside twelve months. Against it sits $3.6 billion of cash plus a $2.0 billion revolver: $5.6 billion of liquidity, investment-grade ratings from all three agencies, and $15.8 billion of unencumbered aircraft, so the wall is payable — but it converts 2027 into a refinancing year at much higher rates. The mirror image is $14,790 million of treasury stock at cost, which is why $16.9 billion of retained earnings compresses into just $7.3 billion of book equity: decades of buybacks, now down to $450 million remaining on the $2.0 billion authorization.
The Multi-Year Arc
Two audited years, two comparative columns, and the current quarter show an airline that repriced its entire product while fuel tripled the stakes.
| Metric | FY2022 | FY2023 | FY2024 | FY2025 | 9M 2026 |
|---|---|---|---|---|---|
| Revenue | $23,814M | $26,091M | $27,483M | $28,063M | $24,104M |
| Operating income | $1,017M | $224M | $321M | $428M | $994M |
| Operating margin | 4.3% | 0.9% | 1.2% | 1.5% | 4.1% |
| Net income | $539M | $465M | $465M | $441M | $730M |
| Fuel expense | $5,975M | $6,217M | $5,812M | $5,240M | $5,723M |
| Air traffic liability (total) | — | — | $8,242M | $7,164M | $8,277M |
| Treasury stock, at cost | — | — | $11,044M | $13,593M | $14,790M |
Revenue compounded 8.6% annually from 2022 to 2025 while operating income collapsed and rebuilt — $1.0 billion to $0.2 billion and back to $1.0 billion in nine months. Labor contracts explain the valley: salaries rose from $9.4 billion in 2022 to $13.0 billion in 2025 (+38%) while revenue grew 18%. Nine-month 2026 fuel of $5.7 billion already exceeds the full year 2025 bill, yet operating income more than doubled the 2025 total. The business model crossed over: unit revenue growth now outruns both labor and fuel inflation at the same time.
The balance sheet funded the transformation by spending itself. Treasury stock rose $3.7 billion in under two years as buybacks shrank basic shares from 523 million to 489 million — about 6.5% of the float a year of EPS support — while cash fell from $7.5 billion at the end of 2024 to $3.6 billion. Book equity halved from $10.4 billion to $7.3 billion in 21 months, not from losses but from distributions. That trade looks brilliant if $2.60–$2.85 of adjusted EPS materializes; it leaves less cushion if fuel stays at $4.55.
The Verdict: Bull vs. Bear
Bull Case
- Record Q3 revenue of $8.42B (+21.2%) with RASM +21.6% beating the 17.5–19.5% guide; Q4 RASM guided at +19–21% on 3–4% more capacity.
- Ancillary revenue +46.7% to $898M proves bag fees and assigned/extra-legroom seating monetize; nine-month ancillary of $2.5B is a new recurring engine.
- Operating margin tripled year-over-year to 4.5% despite fuel +$821M; ex-fuel unit costs (CASM-X) rose only 3.8%.
- Managed business revenue hit a third-quarter record with 20 top-50 booking days; corporate and loyalty deepen the high-yield mix.
- $5.6B of liquidity, $15.8B of unencumbered aircraft and three investment-grade ratings cover the $2.15B maturity wall without distress.
Bear Case
- The full-year adjusted EPS guide fell 27% at the midpoint ($3.75 → $2.73) in one quarter; Q4 fuel at $4.55/gal is 16% above Q3 and the guide assumes the fare environment holds.
- Volumes shrank while prices soared: passengers −3.2%, RPMs −0.4%, load flat at 79.8% — the record is a 26.9% fare increase, which reverses fast if demand softens.
- Fuel is 25.6% of revenue (+6.4 pts); at 548M gallons a quarter, each $0.10 of fuel costs ~$55M pre-tax, so the $4.55 assumption owns the quarter.
- Loyalty air-transportation revenue fell 8.8% ($734M vs $805M) even as non-loyalty surged 25% — redemptions lag the "loyalty momentum" narrative.
- Book equity halved to $7.3B in 21 months while treasury stock hit $14.8B; buybacks and dividends consumed the cushion just as 2027 becomes a refinancing year.
Our Take: Southwest built a genuinely new revenue engine — $898 million quarterly ancillary lines don't appear by accident — and proved it can expand margins through a historic fuel spike. But the guide cut tells the truer story: this is still a 4.5%-margin airline facing $4.55 fuel with a $2.15 billion refinancing wall and half the equity cushion it had two years ago. The transformation is real; so is the leverage to the fuel curve. Own it for the pricing power, size it for the $55-million dimes.