Results at a glance
- Period
- FY2026Q3
- Revenue
- NT$1.5T (1,494,243 MTWD)
- Net income
- NT$763.1B (763,064 MTWD)
- Net margin
- 51.1%
From the Tsmc Open LedgerView the live ledgerIssuer filing (FY2026Q3)
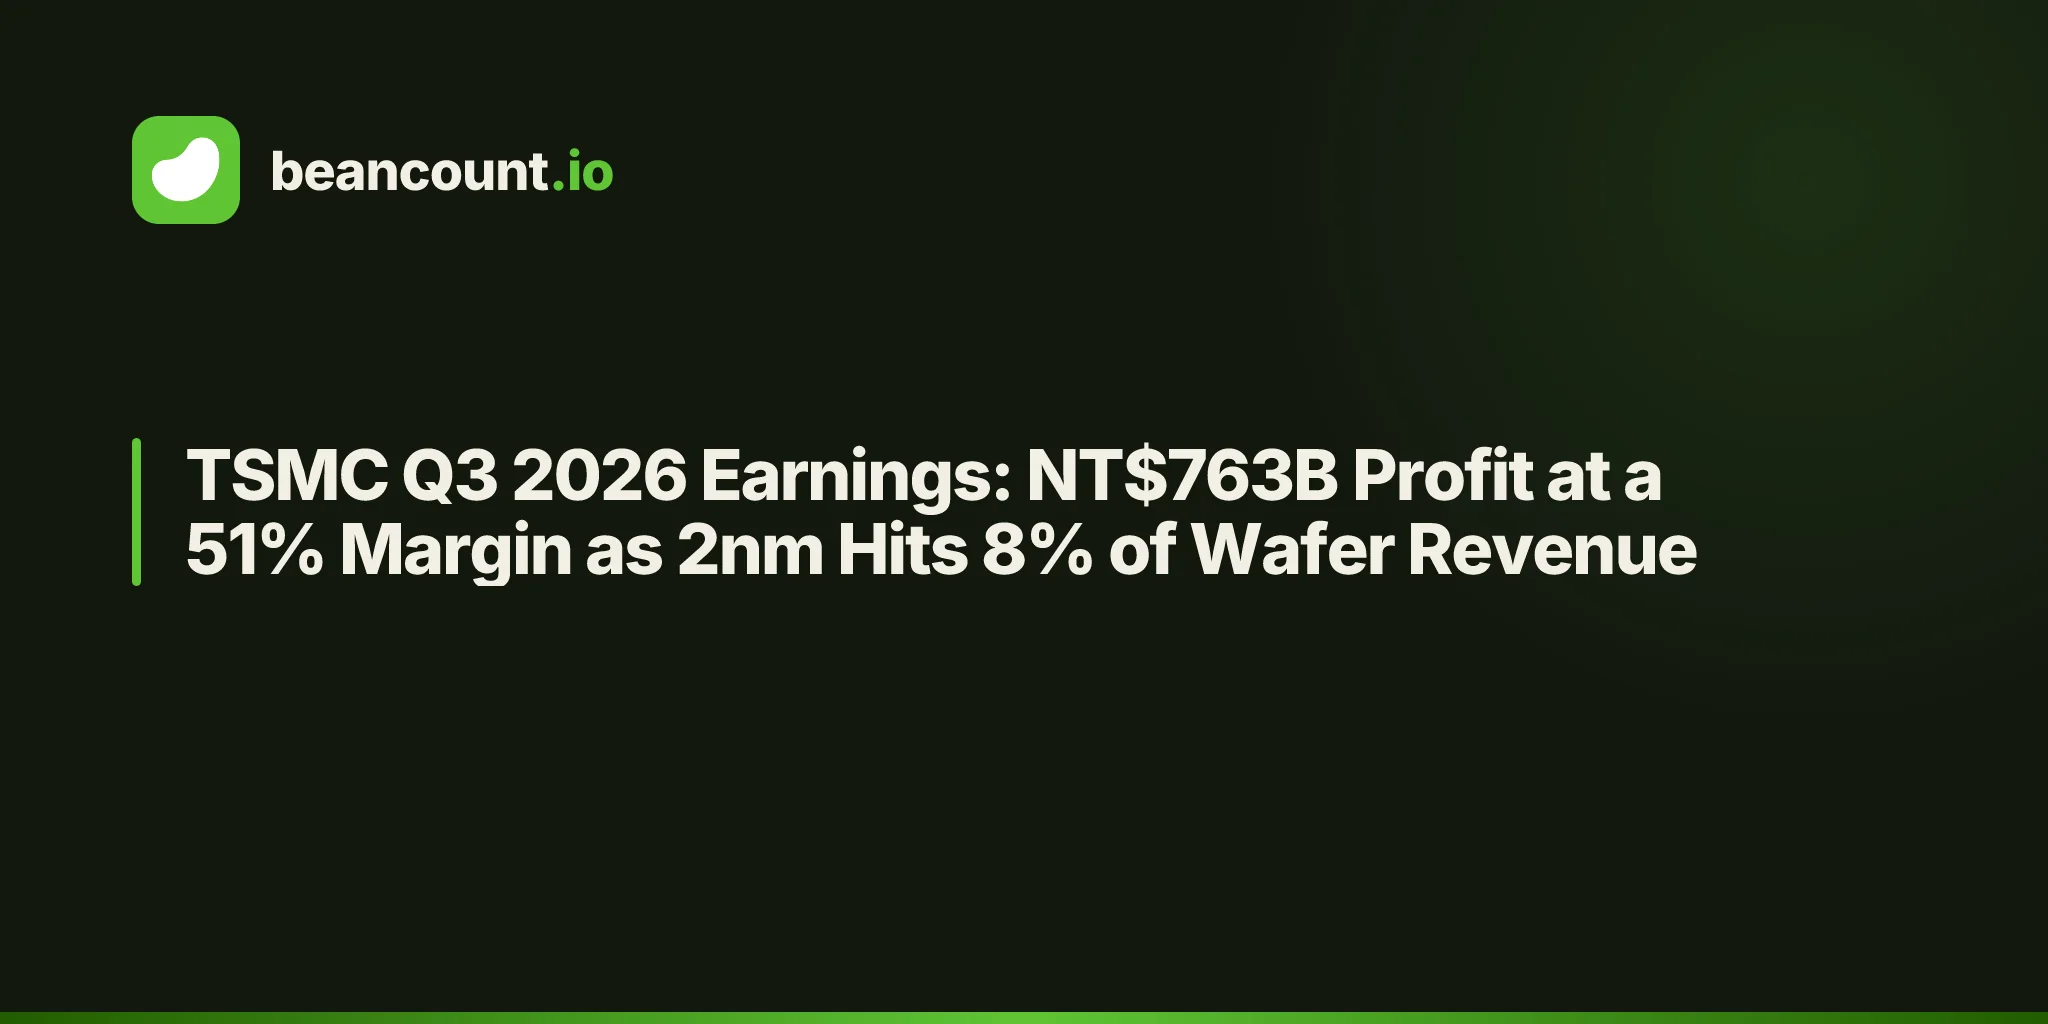
On October 15, 2026, Taiwan Semiconductor Manufacturing Company reported third-quarter net revenue of NT$1,494.24 billion, up 50.9% year-over-year, and net income of NT$763.06 billion, up 68.7% — a 51.1% net margin, with 2-nanometer wafers already 8% of revenue and full-year guidance raised to around 44% growth in US-dollar terms. This is the foundry collecting its toll on the entire AI build-out.
The Headline Numbers
Every figure below comes from the Form 6-K earnings release and the quarterly condensed financial statements. All amounts are in NT$ millions as filed (TSMC's reporting currency), with US-dollar translations at the rates the company prints. No silent conversion.
| Metric | Q3 2026 | Q3 2025 | YoY |
|---|---|---|---|
| Revenue | TWD 1,494,243M | TWD 989,918M | +50.9% |
| Cost of revenue | TWD 501,864M | TWD 401,375M | +25.0% |
| Gross profit | TWD 992,379M | TWD 588,543M | +68.6% |
| Income from operations | TWD 876,445M | TWD 500,685M | +75.0% |
| Net income | TWD 763,064M | TWD 452,302M | +68.7% |
| Diluted EPS | NT$29.43 | NT$17.44 | +68.7% |
Revenue in US dollars was $46.72 billion, up 41.2% year-over-year and above the high end of the $44.6–45.8 billion guidance range, while operating margin at 58.7% beat the guided 56–58% band. The quarter's defining tension sits one layer down: gross margin slipped 1.3 points sequentially to 66.4% even as revenue grew 17.6%, because the steep 2-nanometer ramp dilutes margins before yields mature — CFO Wendell Huang's words, not ours. Year-over-year, though, every margin expanded by 5-plus points, and cost of revenue grew just 25% against 51% revenue growth. That is mix, not volume: wafer shipments rose only 9.6% while revenue per wafer keeps climbing.
Net income grew 8.0% sequentially against 14.3% operating-income growth for two mechanical reasons, both visible in the statements. Non-operating income fell from NT$95.83 billion to NT$34.59 billion because the second quarter held one-off disposal and mark-to-market gains on Vanguard International Semiconductor shares, and other operating income dropped from NT$5.27 billion to NT$0.50 billion as April-2024-earthquake insurance recoveries rolled off. Partly offsetting: the effective tax rate fell to 16.2% from 18.1%, so tax expense actually declined quarter-over-quarter while pre-tax income rose.
Revenue Deep Dive
TSMC discloses revenue three ways — by technology node, by platform, and by geography — and all three tell the same story: leading-edge AI silicon is eating the mix.
| Technology node | Q3 2026 | Q2 2026 | Q3 2025 |
|---|---|---|---|
| 2nm | 8% | 3% | 0% |
| 3nm | 33% | 30% | 23% |
| 5nm | 28% | 33% | 37% |
| 7nm | 10% | 11% | 14% |
| Advanced (7nm and below) | 79% | 77% | 74% |
Two-nanometer revenue nearly tripled its share in a single quarter, from 3% to 8% of wafer revenue, while 3nm added another 3 points. Management said N2 entered high-volume manufacturing in the fourth quarter of 2025 with good yield, is ramping in multiple phases at Hsinchu and Kaohsiung, and will more than double annual capacity in 2027 on demand from both smartphone and HPC/AI. Behind it, A14 risk production is on track for 2027 with volume in 2028 — and C.C. Wei expects A14 to be a bigger node than N2. The pipeline behind the pipeline is the point: TSMC pre-announced three additional 3nm fabs (two in Tainan for 2027 and 2028, Arizona's second fab pulled forward to the third quarter of 2027) plus 5nm-to-3nm tool conversions, breaking its own rule against adding capacity to a node past its target.
| Platform | Q3 2026 share | Approx. revenue | QoQ |
|---|---|---|---|
| HPC (AI + datacenter) | 68% | TWD 1,016,085M | +22% |
| Smartphone | 21% | TWD 313,791M | +10% |
| IoT | 4% | TWD 59,770M | +5% |
| Automotive | 4% | TWD 59,770M | +23% |
| DCE / Others | 3% | TWD 44,827M | −12% / −10% |
Platform dollar figures are shares applied to total revenue, so read them as approximate — but the direction is exact. HPC is now more than two-thirds of the company, up from 57% a year ago, growing 22% sequentially while smartphone seasonality (+10%) and a sharp automotive rebound (+23%) filled in beneath. "Demand for our leading-edge technologies continues to be extremely robust," Wei said, "supported by our strong technology differentiation and broader customer base" — and notably, AI demand is broadening beyond accelerators into agentic-AI CPUs and networking silicon, which sit outside TSMC's narrow AI definition entirely.
Geography completes the picture: North America took 79% of revenue (up from 76% a year ago), Asia Pacific 10%, China just 5% (down from 8%), Japan and EMEA 3% each. Three-quarters-plus of the order book sits with US customers — which is exactly why the capacity debate this quarter was about Arizona, Texas, and fabs that do not exist yet. The balance sheet backs the tightness story: receivables turn in 28 days and inventory in 82, both down sequentially even as shipments rose — nothing is piling up anywhere.
The Margin Story
| Margin | Q3 2025 | Q1 2026 | Q2 2026 | Q3 2026 |
|---|---|---|---|---|
| Gross margin | 59.5% | 66.2% | 67.7% | 66.4% |
| Operating margin | 50.6% | 58.1% | 60.3% | 58.7% |
| Net margin | 45.7% | 50.5% | 55.6% | 51.1% |
The sequential dip is mechanical and management-owned: 130 basis points of gross-margin dilution from the initial N2 ramp, with fourth-quarter guidance calling for another 40 basis points at the midpoint (66%) as N2 dilution continues and overseas fabs weigh in, partly offset by productivity gains and cross-node capacity optimization. R&D ran at 6.0% of revenue and total opex at 7.8%, both flat to down as a share of sales — the margin story is entirely about gross line dilution, not spending discipline.
The multi-year version of that dilution is the overseas build-out. TSMC now expects overseas fabs to dilute gross margin by closer to 2% for full-year 2026, widening to 3–4% in the next few years as more US fabs ramp. Against that sits the pricing lever management refuses to quantify but keeps hinting at: asked about reported price increases, Wei answered that "there is no ceiling for TSMC's profitability," that pricing "depends on the market segment, depends on the location, and depends on the technology," and that US-made wafers will be priced differently from Taiwan-made ones. Reports of increases were neither confirmed nor denied — which, for a company that guides margins to the half-point, is itself a signal. Watch the spread between the 2% overseas dilution this year and the 3–4% coming: every point of it has to come from price, mix, or productivity.
The One Big Question: Can the Fabs Keep Up With the Order Book?
"Based on our assessed demand, we still think the demand is higher than the supply, and we are working very hard to narrow the gap," Wei told analysts. Pressed further: "the demand actually is still far above our capability today to supply." The gap, in his words, "is still quite big" — and customers keep raising their forecasts, which is why he declined to say whether 2027 looks tighter than 2026.
TSMC's answer is a build-out it calls unprecedented: nearly 20 fabs in progress worldwide, 13 leading-edge and advanced-packaging fabs in Taiwan over the next several years plus five to six overseas, 2026 capex reiterated at US$60–64 billion with 2026–2028 spending "significantly higher than the past three years," and — the line of the call — "we have no intention to leave food on the table for others." Nine-month capex already totals US$40.64 billion, implying a US$19–23 billion fourth quarter. The company even sends its own teams to check US data-center build-out and power supply ("so far, so good"), and disciplines capacity top-down and bottom-up against CSP capex, funding, power, and component supply.
| Build-out lever | What was committed |
|---|---|
| N2 capacity | More than double in 2027; HVM since 4Q25 |
| N3 capacity | 3 new fabs (Tainan ×2, Arizona fab 2 in 3Q27); 5nm conversions |
| A14 node | Risk production 2027, volume 2028; expected bigger than N2 |
| Advanced packaging | CoWoS 5x-reticle in volume; 9x/14x in development; GlobalFoundries interposer deal for the back-end shortage |
| US footprint | Arizona fab 2 tool move-in; Texas under evaluation; customer "Terafab" talks ongoing |
The bull case for the build-out is allocation discipline: TSMC forbids customers from subletting wafer allocations ("the amount is very, very small"), so the order book is firmer than in past cycles. The bear case is that the constraint is no longer just TSMC's clean rooms — tool supply is "tight," tool-price inflation is "real," and the back-end shortage forced an interposer deal with GlobalFoundries. When shipments grow 9.6% and revenue grows 50.9%, growth is mix and price, not units — spectacular until the mix stops shifting.
Tracking a NT$10 Trillion Company in Plain Text
A NT$10.05 trillion balance sheet fits in a text file, and that is the point: double-entry bookkeeping forces every dollar of a conglomerate-scale balance sheet to reconcile, so there is nowhere for a bad number to hide. Our ledger follows how we model every company — one zero-sum income transaction per period, balance-sheet assertions against the filing, in the filer's own currency (millions of New Taiwan dollars; the filings' US$ columns are convenience translations and are never posted).
Here is the third quarter's income statement exactly as the ledger records it, including the zero-sum check comment — income posts negative (credit), expenses positive (debit), and the offset is the NT$763,064 million attributable to shareholders of the parent:
; Check: −1494243 + 501864 + 88979 + 27457 + (−502) + (−34594) + 147698 + 277 + 763064 = 0 ✓

2026-09-30 * "Taiwan Semiconductor Manufacturing Company Limited" "FY2026Q3 Income Statement"
  Income:Revenue                             -1494243 MTWD  ; net revenue
  Expenses:CostOfRevenue                       501864 MTWD  ; cost of revenue
  Expenses:ResearchAndDevelopment               88979 MTWD  ; research and development expenses
  Expenses:SellingGeneralAdministrative         27457 MTWD  ; sales, general and administrative expenses
  Income:OtherNet                                 -502 MTWD  ; other operating income and expenses (2Q26's 5,274 held April-2024-quake insurance recoveries)
  Income:OtherNet                                 -34594 MTWD  ; non-operating total: associates 1,510 + net interest income 31,660 + other gains 1,424
  Expenses:IncomeTax                            147698 MTWD  ; income tax expenses (16.2% effective rate)
  Income:OtherNet                                  277 MTWD  ; NCI share of net profit 277, removed so the offset is the parent's profit
  Equity:Adjustments                            763064 MTWD  ; net income attributable to shareholders of the parent (RE set by balance assertion)
The balance-sheet number that tells the whole story is property, plant and equipment: NT$1,975,119 million at the end of 2021 → NT$4,526,488 million at September 30, 2026. The fabs more than doubled in under five years — and cash still grew faster, from NT$1,064,990 million to NT$3,621,894 million, leaving NT$2,985.40 billion of net cash reserves after all interest-bearing debt. TSMC is funding the largest fab build in history out of operating cash flow and getting more liquid doing it.
The Multi-Year Arc
| Fiscal year | Revenue | Gross margin | Net income | PP&E | Cash |
|---|---|---|---|---|---|
| FY2021 | TWD 1,587,415M | 51.6% | TWD 592,359M | TWD 1,975,119M | TWD 1,064,990M |
| FY2022 | TWD 2,263,891M | 59.6% | TWD 992,923M | TWD 2,693,837M | TWD 1,342,814M |
| FY2023 | TWD 2,161,736M | 54.4% | TWD 851,740M | TWD 3,064,475M | TWD 1,465,428M |
| FY2024 | TWD 2,894,308M | 56.1% | TWD 1,158,380M | TWD 3,234,980M | TWD 2,127,627M |
| FY2025 | TWD 3,809,054M | 59.9% | TWD 1,697,604M | TWD 3,691,841M | TWD 2,767,856M |
| 9M 2026 | TWD 3,898,727M | 66.8% | TWD 2,042,106M | TWD 4,526,488M | TWD 3,621,894M |
Revenue compounded at roughly 24% a year from FY2021 to FY2025 while net income compounded at roughly 30% — operating leverage doing its work, with the 2023 downturn (revenue −4.5%, net income −14.2%) as the reminder that this is still a cyclical industry. Nine-month 2026 revenue already exceeds all of FY2025, in both NT$ and US$ terms. Two footnotes complicate the compounding story. First, concentration is rising with scale: the largest customer was 19% of 2025 revenue (NT$726,974 million) and the second 17% — the AI order book is deep but narrow. Second, the dividend is compounding too: cash dividends paid rose from NT$265.79 billion in FY2021 to NT$466.78 billion in FY2025, and the quarterly dividend was just raised to NT$7.00 per share from NT$6.00, payable January 7, 2027.
The Verdict: Bull vs. Bear
Bull Case
- Demand verifiably exceeds supply with allocation discipline behind it: no subletting, rising forecasts, and a CEO saying the gap "is still quite big" — pricing power with a queue.
- The node pipeline is de-risked in sequence: N2 doubling in 2027, three new N3 fabs through 2028, A14 in volume 2028 and guided bigger than N2.
- Guidance was raised, not reiterated: full-year revenue from "slightly above 40%" to around 44% in US$, with Q4 guided to US$52.3–54.3 billion (+58% YoY at the midpoint).
- NT$2.99 trillion of net cash reserves and NT$919.78 billion of quarterly operating cash flow fund the US$60–64 billion capex year internally — no balance-sheet stress at any plausible build pace.
- "No ceiling" on profitability with US-made wafers priced above Taiwan-made ones gives TSMC a contractual offset to the 3–4% overseas dilution coming in the next few years.
Bear Case
- Gross margin fell sequentially (67.7% → 66.4%) and is guided down again (66.0% midpoint) on N2 and overseas dilution that management says widens before it narrows — the 66–68% plateau may be the top.
- Consumer and price-sensitive end markets are "being challenged," and management is explicitly "prudent in business planning going into 2027" — the non-AI two-thirds of wafer starts has no such queue.
- Customer concentration keeps rising: the top two customers are 36% of revenue, so a single roadmap change (insourcing, a node skip) moves the P&L by double digits.
- Growth is mix, not units — shipments +9.6% against revenue +50.9% — and the mix depends on bottlenecks TSMC does not control: tight tool supply, real tool-price inflation, and a back-end shortage already severe enough to require a GlobalFoundries rescue deal.
- China is down to 5% of revenue and 80% of noncurrent assets sit in Taiwan: the market has stopped pricing geopolitical risk into a 45.5% ROE, which is precisely when that risk is most underpriced.
Our Take
Own the toll road, but price it as a toll road facing the largest construction project in its history. TSMC converted a demand-supply gap into a raised guide, a raised dividend, and a balance sheet that got stronger while funding a US$60-billion-plus capex year — that is execution, not multiple expansion. The open question is whether 2027's capacity (N2 doubled, new N3 fabs, widening overseas dilution) arrives as margin-accretive volume or as expensive optionality on forecasts customers keep revising upward. At 51% net margins with demand above supply, we would rather own that question than short it.